Estimated Value: $225,021 - $250,000
3
Beds
2
Baths
1,499
Sq Ft
$159/Sq Ft
Est. Value
About This Home
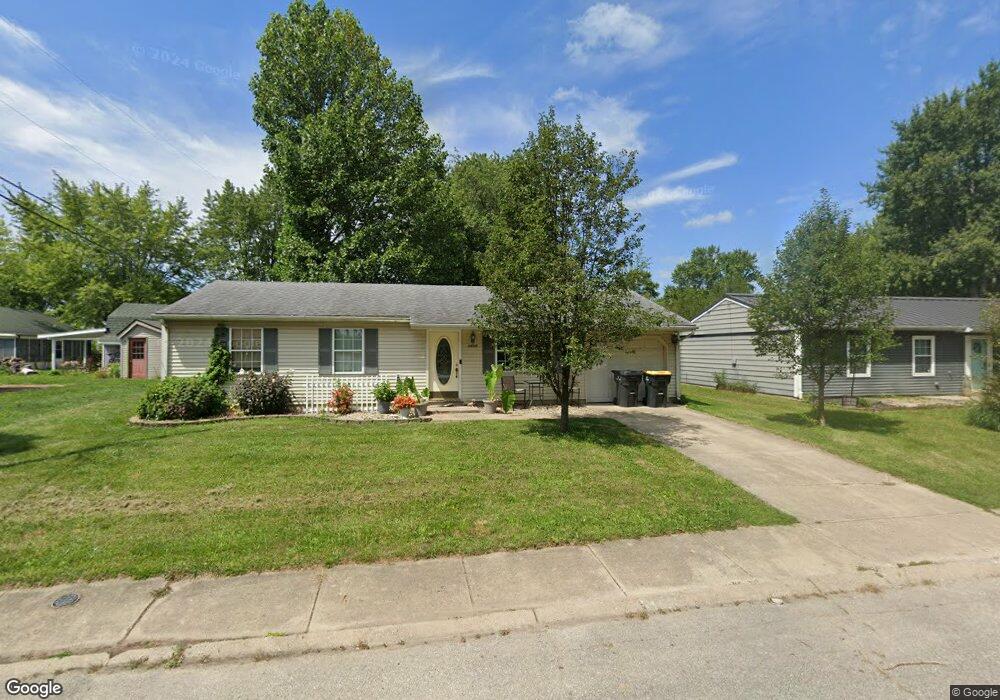
This home is located at 1215 Busby Rd, Lapel, IN 46051 and is currently estimated at $237,755, approximately $158 per square foot. 1215 Busby Rd is a home located in Madison County with nearby schools including Lapel Elementary School, Lapel Middle School, and Lapel Senior High School.
Ownership History
Date
Name
Owned For
Owner Type
Purchase Details
Closed on
Jan 24, 2024
Sold by
Shuck Gary W and Shuck Pamela S
Bought by
Collins Tara
Current Estimated Value
Home Financials for this Owner
Home Financials are based on the most recent Mortgage that was taken out on this home.
Original Mortgage
$75,000
Outstanding Balance
$71,612
Interest Rate
6.95%
Mortgage Type
New Conventional
Estimated Equity
$166,143
Purchase Details
Closed on
Sep 4, 2008
Sold by
Stone Keith A and Stone Susan E
Bought by
Shuck Gary W and Shuck Pamela S
Create a Home Valuation Report for This Property
The Home Valuation Report is an in-depth analysis detailing your home's value as well as a comparison with similar homes in the area
Home Values in the Area
Average Home Value in this Area
Purchase History
| Date | Buyer | Sale Price | Title Company |
|---|---|---|---|
| Collins Tara | $210,000 | First American Title | |
| Shuck Gary W | -- | -- |
Source: Public Records
Mortgage History
| Date | Status | Borrower | Loan Amount |
|---|---|---|---|
| Open | Collins Tara | $75,000 |
Source: Public Records
Tax History
| Year | Tax Paid | Tax Assessment Tax Assessment Total Assessment is a certain percentage of the fair market value that is determined by local assessors to be the total taxable value of land and additions on the property. | Land | Improvement |
|---|---|---|---|---|
| 2025 | $1,362 | $141,000 | $17,400 | $123,600 |
| 2024 | $1,362 | $136,200 | $17,400 | $118,800 |
| 2023 | $2,489 | $124,400 | $16,500 | $107,900 |
| 2022 | $2,815 | $140,700 | $15,600 | $125,100 |
| 2021 | $2,599 | $129,900 | $15,600 | $114,300 |
| 2020 | $2,483 | $124,100 | $14,900 | $109,200 |
| 2019 | $2,547 | $127,300 | $14,900 | $112,400 |
| 2018 | $2,293 | $114,600 | $14,900 | $99,700 |
| 2017 | $2,275 | $113,700 | $14,900 | $98,800 |
| 2016 | $2,275 | $113,700 | $14,900 | $98,800 |
| 2014 | $2,208 | $109,900 | $14,900 | $95,000 |
| 2013 | $2,208 | $110,000 | $14,900 | $95,100 |
Source: Public Records
Map
Nearby Homes
- 1411 Woodward St
- 312 E 10th St
- 223 W 9th St
- 535 Central Ave
- 610 Persimmon Pass
- 313 W 5th St
- 316 S Ford St
- 0 State Hwy 13 & 38 Hwy Unit MBR22080941
- 3110 Montgomery Blvd
- 9417 Crimson Cir
- 9436 Crimson Cir
- 0 Cyntheanne Rd Unit MBR22071501
- 0 W 300 S Unit MBR22051203
- 20765 Cyntheanne Rd
- 1592.5 S State Road 13
- 5615 S State Road 13
- 15123 E 196th St
- 15145 E 196th St
- 0 E 211th St Unit MBR22084030
- 0 E 196th St Unit MBR22082947
Your Personal Tour Guide
Ask me questions while you tour the home.