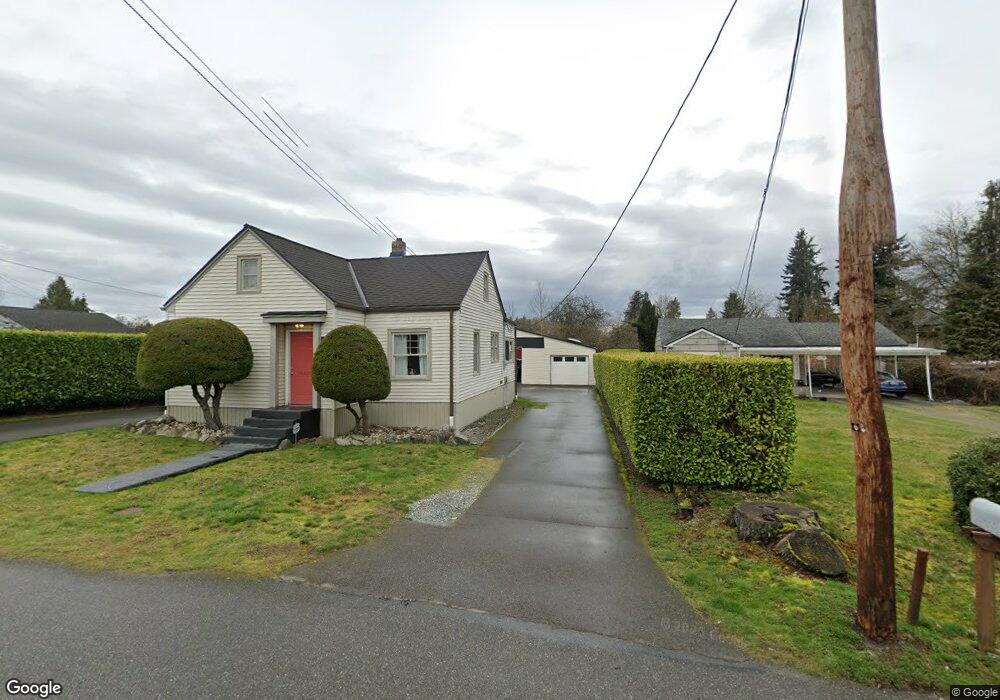
1215 Cascade Dr Everett, WA 98203
Pinehurst NeighborhoodEstimated Value: $566,336 - $610,000
3
Beds
2
Baths
1,290
Sq Ft
$459/Sq Ft
Est. Value
About This Home
This home is located at 1215 Cascade Dr, Everett, WA 98203 and is currently estimated at $591,584, approximately $458 per square foot. 1215 Cascade Dr is a home located in Snohomish County with nearby schools including Emerson Elementary School, Evergreen Middle School, and Cascade High School.
Ownership History
Date
Name
Owned For
Owner Type
Purchase Details
Closed on
Jan 5, 2017
Sold by
Quintana Elias S
Bought by
Quintana Patricia M
Current Estimated Value
Purchase Details
Closed on
Dec 4, 2001
Sold by
Loney Del R and Loney Gini
Bought by
Quintana Elias S and Quintana Patricia M
Home Financials for this Owner
Home Financials are based on the most recent Mortgage that was taken out on this home.
Original Mortgage
$144,130
Outstanding Balance
$52,613
Interest Rate
6.57%
Mortgage Type
FHA
Estimated Equity
$538,971
Purchase Details
Closed on
Aug 13, 2001
Sold by
Barger Elnora E
Bought by
Loney Del R
Purchase Details
Closed on
Apr 3, 2000
Sold by
Petrakis John
Bought by
Barger Elnora E
Home Financials for this Owner
Home Financials are based on the most recent Mortgage that was taken out on this home.
Original Mortgage
$124,100
Interest Rate
8.3%
Create a Home Valuation Report for This Property
The Home Valuation Report is an in-depth analysis detailing your home's value as well as a comparison with similar homes in the area
Home Values in the Area
Average Home Value in this Area
Purchase History
| Date | Buyer | Sale Price | Title Company |
|---|---|---|---|
| Quintana Patricia M | -- | None Available | |
| Quintana Elias S | $162,000 | -- | |
| Loney Del R | $113,300 | Chicago Title Insurance Co | |
| Barger Elnora E | -- | -- |
Source: Public Records
Mortgage History
| Date | Status | Borrower | Loan Amount |
|---|---|---|---|
| Open | Quintana Elias S | $144,130 | |
| Previous Owner | Barger Elnora E | $124,100 |
Source: Public Records
Tax History
| Year | Tax Paid | Tax Assessment Tax Assessment Total Assessment is a certain percentage of the fair market value that is determined by local assessors to be the total taxable value of land and additions on the property. | Land | Improvement |
|---|---|---|---|---|
| 2026 | $4,566 | $554,600 | $388,000 | $166,600 |
| 2025 | $4,292 | $522,600 | $363,000 | $159,600 |
| 2024 | $4,292 | $498,600 | $339,000 | $159,600 |
| 2023 | $4,361 | $529,900 | $339,000 | $190,900 |
| 2022 | $3,928 | $428,100 | $263,000 | $165,100 |
| 2020 | $3,876 | $344,600 | $195,000 | $149,600 |
| 2019 | $3,629 | $324,700 | $177,000 | $147,700 |
| 2018 | $3,537 | $290,200 | $156,000 | $134,200 |
| 2017 | $3,235 | $264,400 | $139,000 | $125,400 |
| 2016 | $2,673 | $229,500 | $108,000 | $121,500 |
| 2015 | $2,484 | $200,900 | $99,000 | $101,900 |
| 2013 | $2,266 | $161,700 | $76,000 | $85,700 |
Source: Public Records
Map
Nearby Homes
- 27 M Cascade Dr
- 7515 Cascade Dr
- 7822 Beverly Blvd Unit A
- 1716 Scenic Dr
- 7807 Grant Dr
- 7203 Olympic Dr
- 747 75th St SE Unit B203
- 7027 Rainier Dr Unit E
- 7027 Rainier Dr Unit G
- 7027 Rainier Dr Unit A
- 1916 78th Place SE
- 1910 75th St SE Unit 2E
- 820 Cady Rd Unit H203
- 820 Cady Rd Unit H304
- 820 Cady Rd Unit H101
- 820 Cady Rd Unit B305
- 820 Cady Rd Unit F103
- 7921 20th Ave SE
- 8204 Spokane Dr Unit 302
- 615 75th St SE Unit C53
- 1219 Cascade Dr
- 7715 Rainier Dr
- 7713 Rainier Dr
- 1227 Cascade Dr
- 1205 Cascade Dr
- 7712 Cascade Dr
- 7718 Cascade Dr
- 7701 Rainier Dr
- 1216 Cascade Dr
- 1230 Cascade Dr
- 7702 Cascade Dr
- 1224 Cascade Dr
- 7718 Rainier Dr
- 7716 Rainier Dr
- 7710 Cascade Dr
- 7710 Rainier Dr
- 7625 Rainier Dr Unit C
- 7619 Rainier Dr Unit B
- 7714 Rainier Dr
- 7704 Cascade Dr
Your Personal Tour Guide
Ask me questions while you tour the home.