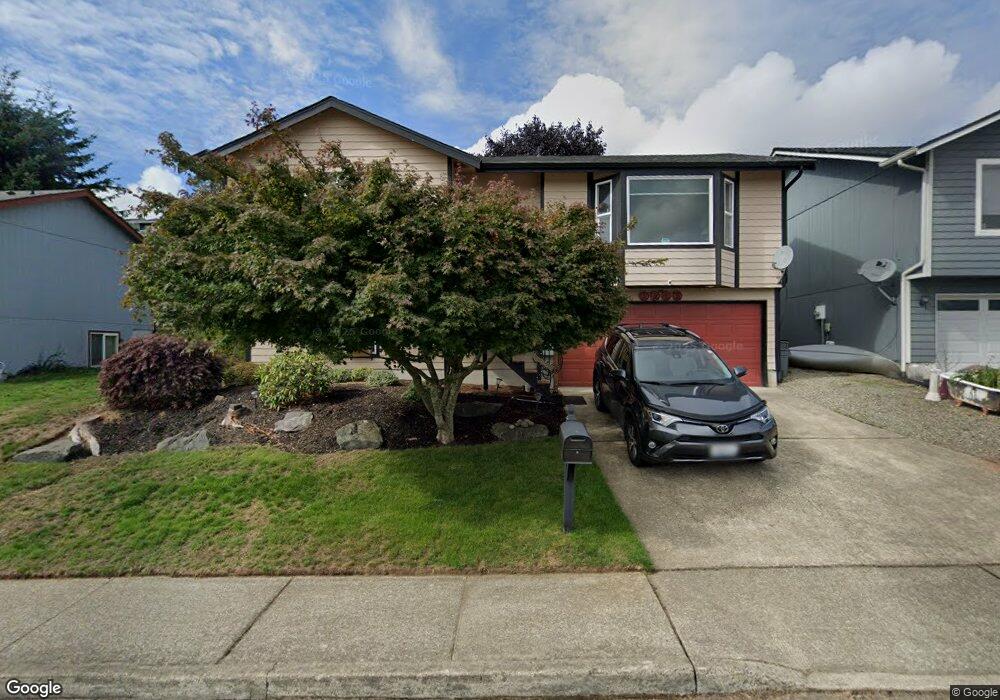
1215 Daniels Ave Bremerton, WA 98312
Pixie Park NeighborhoodEstimated Value: $476,000 - $503,000
2
Beds
3
Baths
1,161
Sq Ft
$417/Sq Ft
Est. Value
About This Home
This home is located at 1215 Daniels Ave, Bremerton, WA 98312 and is currently estimated at $484,344, approximately $417 per square foot. 1215 Daniels Ave is a home located in Kitsap County with nearby schools including West Hills S.T.E.M. Academy, Mountain View Middle School, and Bremerton High School.
Ownership History
Date
Name
Owned For
Owner Type
Purchase Details
Closed on
Apr 22, 2003
Sold by
Koets Steven L
Bought by
Widell Austin J and Lewis Widell Cristiane
Current Estimated Value
Home Financials for this Owner
Home Financials are based on the most recent Mortgage that was taken out on this home.
Original Mortgage
$167,700
Outstanding Balance
$68,065
Interest Rate
5%
Mortgage Type
Purchase Money Mortgage
Estimated Equity
$416,279
Purchase Details
Closed on
May 24, 2002
Sold by
Haselwood Charles C and Haselwood Joanne L
Bought by
Koetz Steven L
Purchase Details
Closed on
Apr 14, 1999
Sold by
Burley Ronald F and Burley Maureen R
Bought by
Koets Steven L
Home Financials for this Owner
Home Financials are based on the most recent Mortgage that was taken out on this home.
Original Mortgage
$120,360
Interest Rate
7.04%
Mortgage Type
VA
Create a Home Valuation Report for This Property
The Home Valuation Report is an in-depth analysis detailing your home's value as well as a comparison with similar homes in the area
Home Values in the Area
Average Home Value in this Area
Purchase History
| Date | Buyer | Sale Price | Title Company |
|---|---|---|---|
| Widell Austin J | $167,700 | Transnation Title Insurance | |
| Koetz Steven L | -- | -- | |
| Koets Steven L | $120,839 | First American Title Ins |
Source: Public Records
Mortgage History
| Date | Status | Borrower | Loan Amount |
|---|---|---|---|
| Open | Widell Austin J | $167,700 | |
| Previous Owner | Koets Steven L | $120,360 |
Source: Public Records
Tax History Compared to Growth
Tax History
| Year | Tax Paid | Tax Assessment Tax Assessment Total Assessment is a certain percentage of the fair market value that is determined by local assessors to be the total taxable value of land and additions on the property. | Land | Improvement |
|---|---|---|---|---|
| 2026 | $3,893 | $441,370 | $77,390 | $363,980 |
| 2025 | $3,893 | $441,370 | $77,390 | $363,980 |
| 2024 | $3,757 | $441,370 | $77,390 | $363,980 |
| 2023 | $3,883 | $441,370 | $77,390 | $363,980 |
| 2022 | $3,608 | $368,690 | $64,490 | $304,200 |
| 2021 | $3,535 | $330,640 | $48,720 | $281,920 |
| 2020 | $3,287 | $307,200 | $45,090 | $262,110 |
| 2019 | $2,840 | $274,930 | $40,250 | $234,680 |
| 2018 | $3,237 | $205,250 | $30,260 | $174,990 |
| 2017 | $2,687 | $205,250 | $30,260 | $174,990 |
| 2016 | $2,496 | $180,420 | $26,550 | $153,870 |
| 2015 | $2,235 | $160,790 | $28,870 | $131,920 |
| 2014 | -- | $152,370 | $28,870 | $123,500 |
| 2013 | -- | $162,390 | $30,470 | $131,920 |
Source: Public Records
Map
Nearby Homes
- 1210 Daniels Ave
- 1303 Daniels Ave
- 4321 W C St
- 1270 Lansing Ave W
- 1301 Humphrey Ave W
- 901 Oyster Bay Ave S
- 0 Sound Ridge Dr Unit NWM2327509
- 1309 Poindexter Ave W Unit A-B
- 1641 Bayview Dr W
- 0 Werner Rd Unit NWM2391646
- 1122 Evans Ave W
- 2101 3rd Ave W
- 4115 W I St
- 1745 W Sunn Fjord Ln Unit H307
- 3723 W D St
- 5071 Granger St
- 3720 W G St
- 0 Front Ave W
- 5098 Granger St
- 3635 W F St
- 1211 Daniels Ave
- 1219 Daniels Ave
- 1234 Lansing Ave W
- 1209 Daniels Ave
- 1228 Lansing Ave W
- 1238 Lansing Ave W
- 1225 Daniels Ave
- 1218 Lansing Ave W
- 1246 Lansing Ave W
- 1214 Daniels Ave
- 1218 Daniels Ave
- 1207 Daniels Ave
- 1229 Daniels Ave
- 1216 Lansing Ave W
- 1248 Lansing Ave W
- 1208 Daniels Ave
- 1224 Daniels Ave
- 1205 Daniels Ave
- 1214 Lansing Ave W
- 1250 Lansing Ave W