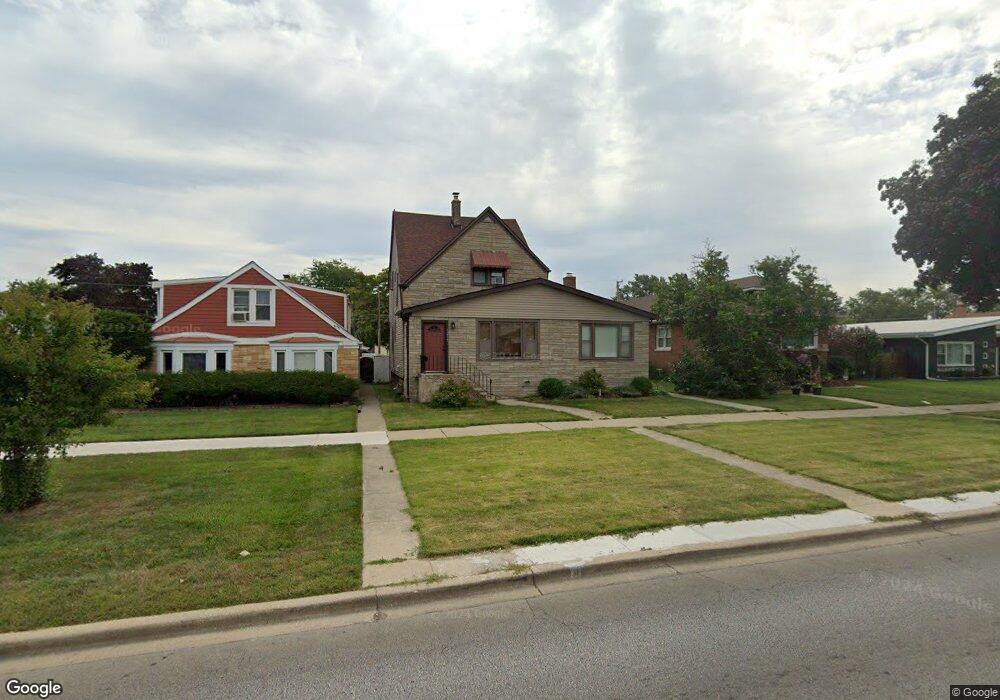
1215 N 19th Ave Melrose Park, IL 60160
Estimated Value: $391,000 - $472,000
4
Beds
2
Baths
2,744
Sq Ft
$161/Sq Ft
Est. Value
About This Home
This home is located at 1215 N 19th Ave, Melrose Park, IL 60160 and is currently estimated at $442,609, approximately $161 per square foot. 1215 N 19th Ave is a home located in Cook County with nearby schools including Lincoln Elementary School, Stevenson Middle School, and Proviso East High School.
Ownership History
Date
Name
Owned For
Owner Type
Purchase Details
Closed on
Jun 15, 2023
Sold by
Adorno Arlene
Bought by
Lopez Luis and Zepeda Espinoza
Current Estimated Value
Home Financials for this Owner
Home Financials are based on the most recent Mortgage that was taken out on this home.
Original Mortgage
$382,936
Outstanding Balance
$372,621
Interest Rate
6.35%
Mortgage Type
FHA
Estimated Equity
$69,988
Purchase Details
Closed on
Feb 14, 2018
Sold by
Friedman David N
Bought by
Adorno Arlene
Home Financials for this Owner
Home Financials are based on the most recent Mortgage that was taken out on this home.
Original Mortgage
$240,562
Interest Rate
4.37%
Mortgage Type
FHA
Purchase Details
Closed on
Oct 1, 2013
Sold by
Chicago Title Land Trust Co
Bought by
Friedman David
Home Financials for this Owner
Home Financials are based on the most recent Mortgage that was taken out on this home.
Original Mortgage
$177,721
Interest Rate
3.75%
Mortgage Type
FHA
Create a Home Valuation Report for This Property
The Home Valuation Report is an in-depth analysis detailing your home's value as well as a comparison with similar homes in the area
Home Values in the Area
Average Home Value in this Area
Purchase History
| Date | Buyer | Sale Price | Title Company |
|---|---|---|---|
| Lopez Luis | $390,000 | None Listed On Document | |
| Adorno Arlene | $245,000 | Greater Illinois Title | |
| Friedman David | $181,000 | Premier Title |
Source: Public Records
Mortgage History
| Date | Status | Borrower | Loan Amount |
|---|---|---|---|
| Open | Lopez Luis | $382,936 | |
| Previous Owner | Adorno Arlene | $240,562 | |
| Previous Owner | Friedman David | $177,721 |
Source: Public Records
Tax History Compared to Growth
Tax History
| Year | Tax Paid | Tax Assessment Tax Assessment Total Assessment is a certain percentage of the fair market value that is determined by local assessors to be the total taxable value of land and additions on the property. | Land | Improvement |
|---|---|---|---|---|
| 2024 | $4,425 | $19,515 | $2,970 | $16,545 |
| 2023 | $4,830 | $19,515 | $2,970 | $16,545 |
| 2022 | $4,830 | $18,240 | $2,558 | $15,682 |
| 2021 | $4,925 | $18,238 | $2,557 | $15,681 |
| 2020 | $4,840 | $18,238 | $2,557 | $15,681 |
| 2019 | $6,326 | $19,515 | $2,310 | $17,205 |
| 2018 | $5,471 | $19,515 | $2,310 | $17,205 |
| 2017 | $5,362 | $19,515 | $2,310 | $17,205 |
| 2016 | $4,676 | $16,461 | $2,062 | $14,399 |
| 2015 | $4,573 | $16,461 | $2,062 | $14,399 |
| 2014 | $5,033 | $16,461 | $2,062 | $14,399 |
| 2013 | $1,747 | $18,312 | $2,062 | $16,250 |
Source: Public Records
Map
Nearby Homes
- 1514 N 22nd Ave
- 1540 N 21st Ave
- 805 N 22nd Ave
- 149 N 21st Ave
- 1418 N 24th Ave
- 1531 N 24th Ave
- 1630 N 15th Ave
- 1209 Helen Dr
- 1634 N 22nd Ave
- 1303 Rice St
- 132 N 22nd Ave
- 1200 N 11th Ave
- 1114 N 11th Ave
- 133 N 17th Ave
- 1724 N 19th Ave
- 923 Division St
- 101 N 23rd Ave
- 1718 N 15th Ave
- 1710 N 23rd Ave
- 1616 N 12th Ave
- 1215 N 19th Ave
- 1211 N 19th Ave
- 1219 N 19th Ave
- 1219 N 19th Ave
- 1205 N 19th Ave
- 1205 Broadway Ave
- 1214 N 18th Ave
- 1201 N 19th Ave
- 1218 N 18th Ave
- 1204 N 18th Ave
- 1204 N 18th Ave
- 1202 N 18th Ave
- 1301 N 19th Ave
- 1301 N 19th Ave
- 1301 Broadway Ave
- 1214 N 19th Ave
- 1210 N 19th Ave
- 1218 N 19th Ave
- 1206 Broadway
- 1307 N 19th Ave