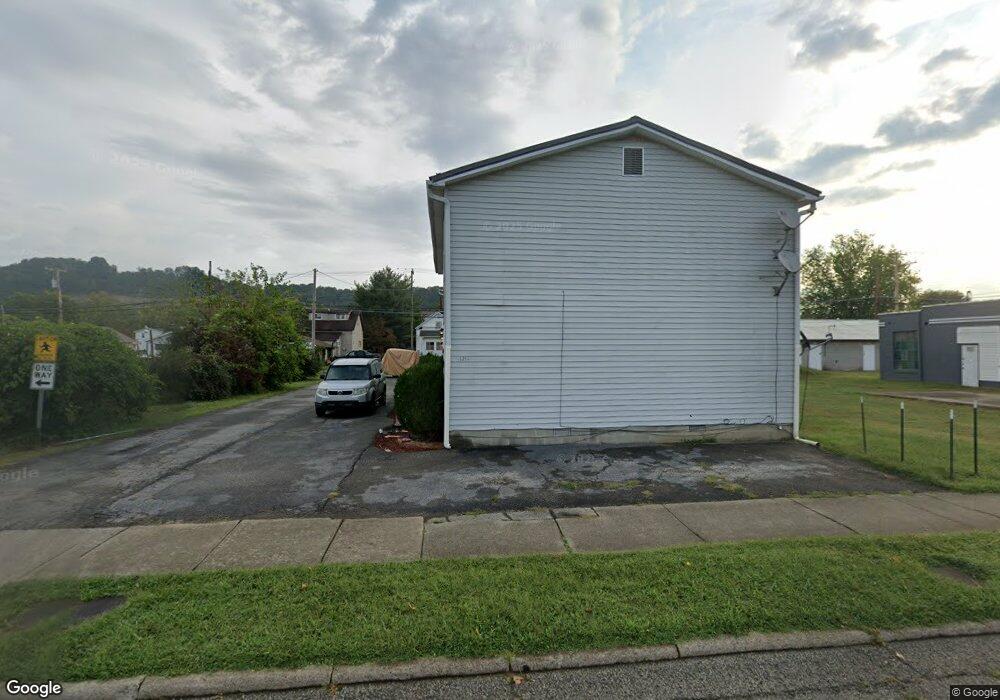
1215 N 2nd St Ironton, OH 45638
Estimated Value: $152,000 - $233,000
12
Beds
6
Baths
4,704
Sq Ft
$41/Sq Ft
Est. Value
About This Home
This home is located at 1215 N 2nd St, Ironton, OH 45638 and is currently estimated at $192,500, approximately $40 per square foot. 1215 N 2nd St is a home located in Lawrence County with nearby schools including Ironton Elementary School, Ironton Middle School, and Ironton High School.
Ownership History
Date
Name
Owned For
Owner Type
Purchase Details
Closed on
May 18, 2005
Sold by
Classic Bank
Bought by
Glover Isaac M
Current Estimated Value
Home Financials for this Owner
Home Financials are based on the most recent Mortgage that was taken out on this home.
Original Mortgage
$98,000
Interest Rate
5.91%
Mortgage Type
Future Advance Clause Open End Mortgage
Purchase Details
Closed on
Dec 2, 2003
Sold by
Spainhower Darren R and Spainhower K
Bought by
Classic Bank, An Ohio Cor
Purchase Details
Closed on
May 20, 1999
Sold by
Hankins Calvin and Hankins Brian
Bought by
Spainhower Darren R and Spainhower K
Purchase Details
Closed on
Oct 10, 1996
Sold by
Howland Cecil E and Howland Helen
Bought by
Hankins Calvin and Hankins Brian
Purchase Details
Closed on
Mar 18, 1994
Sold by
Howland Cecil Eugene and Howland H
Bought by
Howland Cecil E and Howland Helen
Create a Home Valuation Report for This Property
The Home Valuation Report is an in-depth analysis detailing your home's value as well as a comparison with similar homes in the area
Home Values in the Area
Average Home Value in this Area
Purchase History
| Date | Buyer | Sale Price | Title Company |
|---|---|---|---|
| Glover Isaac M | $70,000 | None Available | |
| Classic Bank, An Ohio Cor | -- | -- | |
| Spainhower Darren R | $175,000 | -- | |
| Hankins Calvin | $13,100 | -- | |
| Howland Cecil E | -- | -- |
Source: Public Records
Mortgage History
| Date | Status | Borrower | Loan Amount |
|---|---|---|---|
| Closed | Glover Isaac M | $98,000 |
Source: Public Records
Tax History Compared to Growth
Tax History
| Year | Tax Paid | Tax Assessment Tax Assessment Total Assessment is a certain percentage of the fair market value that is determined by local assessors to be the total taxable value of land and additions on the property. | Land | Improvement |
|---|---|---|---|---|
| 2024 | -- | $102,500 | $2,630 | $99,870 |
| 2023 | $3,753 | $102,500 | $2,630 | $99,870 |
| 2022 | $3,752 | $102,500 | $2,630 | $99,870 |
| 2021 | $3,330 | $86,450 | $2,490 | $83,960 |
| 2020 | $3,346 | $86,450 | $2,490 | $83,960 |
| 2019 | $3,333 | $86,450 | $2,490 | $83,960 |
| 2018 | $3,370 | $86,450 | $2,490 | $83,960 |
| 2017 | $3,363 | $86,450 | $2,490 | $83,960 |
| 2016 | $3,165 | $86,450 | $2,490 | $83,960 |
| 2015 | $3,010 | $79,330 | $2,490 | $76,840 |
| 2014 | $2,981 | $79,330 | $2,490 | $76,840 |
| 2013 | $2,900 | $79,330 | $2,490 | $76,840 |
Source: Public Records
Map
Nearby Homes