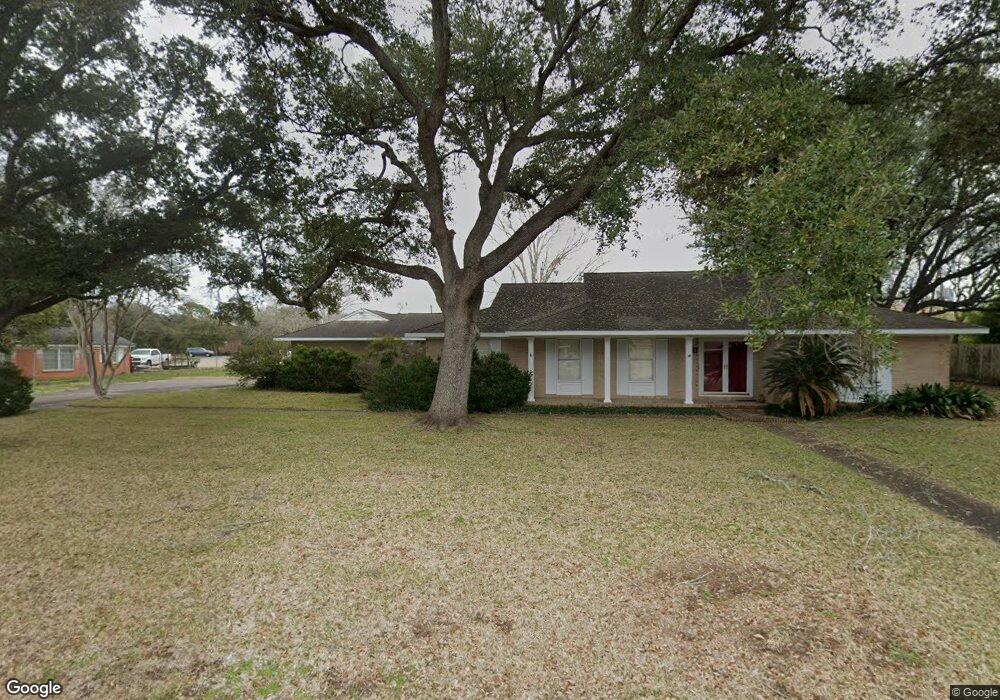
1215 Oak Creek Dr Richmond, TX 77469
Estimated Value: $296,319 - $359,000
4
Beds
2
Baths
2,606
Sq Ft
$127/Sq Ft
Est. Value
About This Home
This home is located at 1215 Oak Creek Dr, Richmond, TX 77469 and is currently estimated at $330,330, approximately $126 per square foot. 1215 Oak Creek Dr is a home located in Fort Bend County with nearby schools including Jane Long Elementary School, J J Wessendorff Middle School, and Lamar Junior High School.
Ownership History
Date
Name
Owned For
Owner Type
Purchase Details
Closed on
Jan 6, 2014
Sold by
Pochyla Linda Remmert
Bought by
Pochyla Gary Wayne
Current Estimated Value
Purchase Details
Closed on
Mar 19, 2013
Sold by
Us Bank Na
Bought by
Pochyla Gary
Purchase Details
Closed on
Feb 11, 2013
Sold by
Ricklefsen Ryan A
Bought by
Us Bank Na
Purchase Details
Closed on
Feb 5, 2013
Sold by
Ricklefsen Ryan A
Bought by
Pochyla Gary
Purchase Details
Closed on
Jul 7, 2006
Sold by
Hayes Ervin Roy and Hayes Marsha H
Bought by
Ricklefsen Ryan A
Home Financials for this Owner
Home Financials are based on the most recent Mortgage that was taken out on this home.
Original Mortgage
$16,300
Interest Rate
6.6%
Mortgage Type
Stand Alone Second
Create a Home Valuation Report for This Property
The Home Valuation Report is an in-depth analysis detailing your home's value as well as a comparison with similar homes in the area
Home Values in the Area
Average Home Value in this Area
Purchase History
| Date | Buyer | Sale Price | Title Company |
|---|---|---|---|
| Pochyla Gary Wayne | -- | None Available | |
| Pochyla Gary | -- | None Available | |
| Pochyla Gary | -- | -- | |
| Us Bank Na | -- | None Available | |
| Pochyla Gary | -- | -- | |
| Ricklefsen Ryan A | -- | Stewart Title Richmond | |
| Pochyla Gary | -- | -- |
Source: Public Records
Mortgage History
| Date | Status | Borrower | Loan Amount |
|---|---|---|---|
| Previous Owner | Pochyla Gary | $16,300 | |
| Previous Owner | Pochyla Gary | $130,400 |
Source: Public Records
Tax History Compared to Growth
Tax History
| Year | Tax Paid | Tax Assessment Tax Assessment Total Assessment is a certain percentage of the fair market value that is determined by local assessors to be the total taxable value of land and additions on the property. | Land | Improvement |
|---|---|---|---|---|
| 2025 | $6,558 | $274,100 | $46,800 | $227,300 |
| 2024 | $6,558 | $296,900 | $46,800 | $250,100 |
| 2023 | $6,095 | $272,330 | $26,359 | $245,971 |
| 2022 | $5,998 | $254,900 | $26,360 | $228,540 |
| 2021 | $5,272 | $222,000 | $26,360 | $195,640 |
| 2020 | $5,492 | $227,860 | $52,720 | $175,140 |
| 2019 | $5,988 | $234,470 | $52,720 | $181,750 |
| 2018 | $5,800 | $225,760 | $52,720 | $173,040 |
| 2017 | $5,716 | $219,920 | $52,720 | $167,200 |
| 2016 | $5,716 | $219,920 | $52,720 | $167,200 |
| 2015 | $4,392 | $166,940 | $52,720 | $114,220 |
| 2014 | $4,266 | $160,680 | $52,720 | $107,960 |
Source: Public Records
Map
Nearby Homes
- 1004 Country Club Dr
- 0 Meadow Ln
- 2015 Tanglelane St
- 2001 Briar Ln
- 805 Chateau Place
- 1922 Teakwood St
- 1805 Hawthorn Dr
- 400 Hillcrest Dr
- 1809 Hawthorn Dr
- 512 and 514 Travis St
- 7315 Audubon Russet Dr
- 7322 Audubon Russet Dr
- 2143 Alabaster Estate Dr
- 406 Fairway Dr
- 1806 Cedar Dr
- 606 Fannin St
- 0 Fm 2218 Unit 25550047
- 1109 Frances Dr
- 505 Austin St
- 6219 Deep Gulch Dr
- 1708 Thompson Rd
- 1119 Oak Creek Dr
- 1305 Oak Creek Dr
- 1206 Oak Creek Dr
- 1214 Oak Creek Dr
- 1204 Oak Creek Dr
- 1302 Oak Creek Dr
- 1107 Oak Creek Dr
- 1317 Oak Creek Dr
- 1114 Oak Creek Dr
- 110 Long Drive Ct
- 1810 Thompson Rd
- 1314 Oak Creek Dr
- 1600 Winston Dr
- 1827 Long Dr
- 1108 Oak Creek Dr
- 1715 Long Dr
- 1006 Country Club Dr
- 112 Long Drive Ct
- 1104 Oak Creek Dr