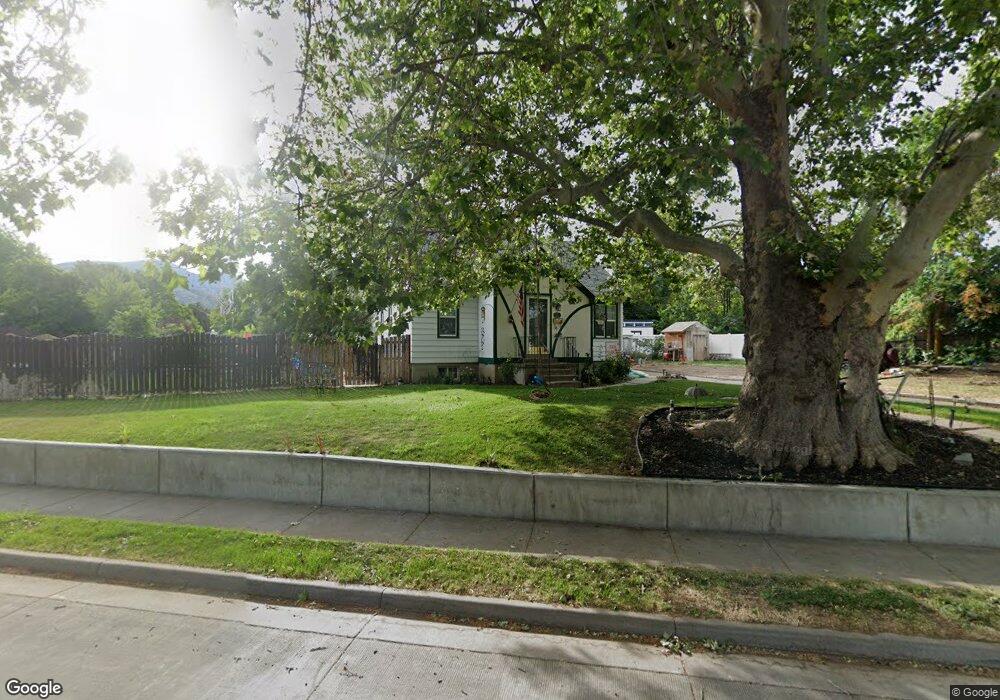
1215 S Main St Bountiful, UT 84010
Estimated Value: $442,000 - $479,000
4
Beds
1
Bath
1,854
Sq Ft
$250/Sq Ft
Est. Value
About This Home
This home is located at 1215 S Main St, Bountiful, UT 84010 and is currently estimated at $463,166, approximately $249 per square foot. 1215 S Main St is a home located in Davis County with nearby schools including Bountiful Elementary School, Millcreek Junior High School, and Bountiful High School.
Ownership History
Date
Name
Owned For
Owner Type
Purchase Details
Closed on
Oct 2, 2023
Sold by
Jolley George B
Bought by
Clarke Rick and Clarke Stephanie
Current Estimated Value
Home Financials for this Owner
Home Financials are based on the most recent Mortgage that was taken out on this home.
Original Mortgage
$94,000
Outstanding Balance
$92,054
Interest Rate
7.09%
Mortgage Type
New Conventional
Estimated Equity
$371,112
Purchase Details
Closed on
Dec 15, 2021
Sold by
Tingey Casandra
Bought by
Jolley George B
Home Financials for this Owner
Home Financials are based on the most recent Mortgage that was taken out on this home.
Original Mortgage
$397,664
Interest Rate
3.09%
Mortgage Type
FHA
Purchase Details
Closed on
Apr 29, 2005
Sold by
Stanfield Kevin D and Stanfield Melinda C
Bought by
Gardner Chad B
Purchase Details
Closed on
Sep 24, 1997
Sold by
Perkins Gayle and Barber Orpha L
Bought by
Stanfield Kevin D and Stanfield Melinda C
Home Financials for this Owner
Home Financials are based on the most recent Mortgage that was taken out on this home.
Original Mortgage
$97,137
Interest Rate
7.54%
Mortgage Type
FHA
Create a Home Valuation Report for This Property
The Home Valuation Report is an in-depth analysis detailing your home's value as well as a comparison with similar homes in the area
Home Values in the Area
Average Home Value in this Area
Purchase History
| Date | Buyer | Sale Price | Title Company |
|---|---|---|---|
| Clarke Rick | -- | None Listed On Document | |
| Jolley George B | -- | Title Guarantee Rive | |
| Gardner Chad B | -- | Advanced Title Ins Agency | |
| Stanfield Kevin D | -- | Backman Stewart Title Servic |
Source: Public Records
Mortgage History
| Date | Status | Borrower | Loan Amount |
|---|---|---|---|
| Open | Clarke Rick | $94,000 | |
| Previous Owner | Jolley George B | $397,664 | |
| Previous Owner | Stanfield Kevin D | $97,137 |
Source: Public Records
Tax History Compared to Growth
Tax History
| Year | Tax Paid | Tax Assessment Tax Assessment Total Assessment is a certain percentage of the fair market value that is determined by local assessors to be the total taxable value of land and additions on the property. | Land | Improvement |
|---|---|---|---|---|
| 2025 | $2,585 | $227,150 | $135,830 | $91,320 |
| 2024 | $2,392 | $218,900 | $124,539 | $94,361 |
| 2023 | $2,287 | $380,000 | $226,182 | $153,818 |
| 2022 | $2,497 | $217,800 | $122,724 | $95,076 |
| 2021 | $2,321 | $292,000 | $136,626 | $155,374 |
| 2020 | $2,107 | $258,000 | $115,712 | $142,288 |
| 2019 | $1,956 | $242,000 | $115,634 | $126,366 |
| 2018 | $1,657 | $220,000 | $113,204 | $106,796 |
| 2016 | $1,451 | $104,445 | $48,891 | $55,554 |
| 2015 | $1,409 | $95,535 | $48,891 | $46,644 |
| 2014 | $1,569 | $111,315 | $48,891 | $62,424 |
| 2013 | -- | $93,862 | $42,122 | $51,740 |
Source: Public Records
Map
Nearby Homes