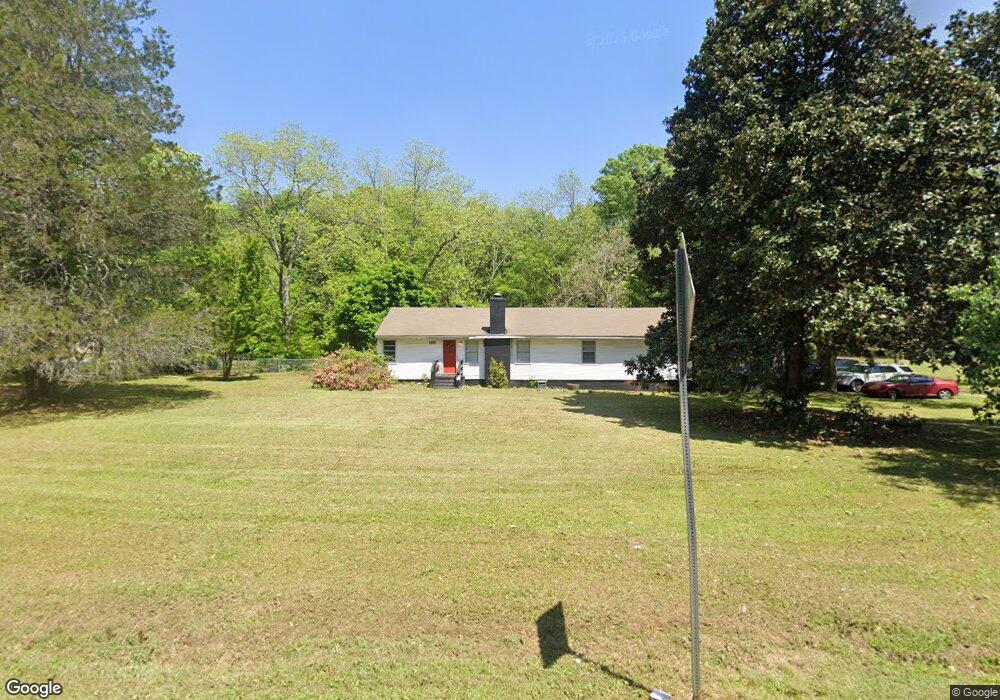
1215 Vineyard Rd Griffin, GA 30223
Spalding County NeighborhoodEstimated Value: $221,000 - $286,000
4
Beds
2
Baths
1,600
Sq Ft
$155/Sq Ft
Est. Value
About This Home
This home is located at 1215 Vineyard Rd, Griffin, GA 30223 and is currently estimated at $248,163, approximately $155 per square foot. 1215 Vineyard Rd is a home located in Spalding County with nearby schools including Cowan Road Elementary School, Cowan Road Middle School, and Griffin High School.
Ownership History
Date
Name
Owned For
Owner Type
Purchase Details
Closed on
May 20, 2020
Sold by
Simmons Melissa H
Bought by
Simmons Melissa H and Simmons Orvin Kendall
Current Estimated Value
Home Financials for this Owner
Home Financials are based on the most recent Mortgage that was taken out on this home.
Original Mortgage
$126,170
Outstanding Balance
$111,804
Interest Rate
3.3%
Mortgage Type
FHA
Estimated Equity
$136,359
Purchase Details
Closed on
Dec 12, 2019
Sold by
Conaway Scott Alan
Bought by
Salemi Angela
Purchase Details
Closed on
Nov 7, 2017
Sold by
Sanders Kathleen S
Bought by
Conaway Scott Alan
Home Financials for this Owner
Home Financials are based on the most recent Mortgage that was taken out on this home.
Original Mortgage
$45,000
Interest Rate
3.91%
Mortgage Type
Unknown
Purchase Details
Closed on
Oct 12, 1985
Sold by
Sanders Green H
Bought by
Sanders Kathleen
Purchase Details
Closed on
Oct 22, 1953
Bought by
Sanders Green H
Create a Home Valuation Report for This Property
The Home Valuation Report is an in-depth analysis detailing your home's value as well as a comparison with similar homes in the area
Home Values in the Area
Average Home Value in this Area
Purchase History
| Date | Buyer | Sale Price | Title Company |
|---|---|---|---|
| Simmons Melissa H | -- | -- | |
| Simmons Melissa H | $155,000 | -- | |
| Salemi Angela | $71,000 | -- | |
| Conaway Scott Alan | $60,000 | -- | |
| Sanders Kathleen | -- | -- | |
| Sanders Green H | -- | -- |
Source: Public Records
Mortgage History
| Date | Status | Borrower | Loan Amount |
|---|---|---|---|
| Open | Simmons Melissa H | $126,170 | |
| Previous Owner | Conaway Scott Alan | $45,000 |
Source: Public Records
Tax History Compared to Growth
Tax History
| Year | Tax Paid | Tax Assessment Tax Assessment Total Assessment is a certain percentage of the fair market value that is determined by local assessors to be the total taxable value of land and additions on the property. | Land | Improvement |
|---|---|---|---|---|
| 2024 | $3,084 | $88,020 | $5,436 | $82,584 |
| 2023 | $3,084 | $82,064 | $5,436 | $76,628 |
| 2022 | $2,387 | $67,460 | $5,436 | $62,024 |
| 2021 | $2,082 | $57,259 | $5,436 | $51,823 |
| 2020 | $958 | $26,247 | $5,436 | $20,811 |
| 2019 | $976 | $26,211 | $5,400 | $20,811 |
| 2018 | $917 | $24,174 | $5,400 | $18,774 |
| 2017 | $899 | $24,174 | $5,400 | $18,774 |
| 2016 | $915 | $24,174 | $5,400 | $18,774 |
| 2015 | $942 | $24,174 | $5,400 | $18,774 |
| 2014 | $961 | $24,174 | $5,400 | $18,774 |
Source: Public Records
Map
Nearby Homes
- 1156 Burgundy Dr
- 1115 Burgundy Dr
- 204 Vineyard Ridge Dr
- 1022 Serene Lake Dr
- 265 Steele Rd
- 110 Janie Ln
- 813 Vineyard Rd
- 475 Edwards Rd
- 114 King Richard Dr
- 313 Sammy Cir
- 78 Helen Dr
- 1972 Pinecrest Dr Unit 4
- 611A Seminole Dr
- 4920 Fayetteville Rd
- 4940 Fayetteville Rd
- 4946 Fayetteville Rd
- 1949 Bonnie Ridge Dr
- 101 Lexington Place Dr
- 1019 Oakridge Dr
- 220 Beasley Rd
- 1233 Vineyard Rd
- 1191 Vineyard Rd
- 1194 Vineyard Rd
- 70 Steele Rd
- 0 Steele Rd Unit 8462492
- 0 Steele Rd Unit 7223205
- 0 Steele Rd Unit 102AC 7343428
- 0 Steele Rd
- 0 Steele Rd Unit 7630159
- 0 Steele Rd Unit 7605028
- 0 Steele Rd Unit 7525350
- 0 Steele Rd Unit 7322618
- 0 Steele Rd Unit 8967312
- 0 Steele Rd Unit 8981052
- 0 Steele Rd Unit 8774582
- 0 Steele Rd Unit 8777650
- 0 Steele Rd Unit 8829350
- 0 Steele Rd Unit 8877007
- 0 Steele Rd Unit 8900393
- 0 Steele Rd Unit 8762048