
Seller's Agent in 2015
Ronald Duff
RE/MAX Professionals
(217) 652-6025
4 in this area
109 Total Sales

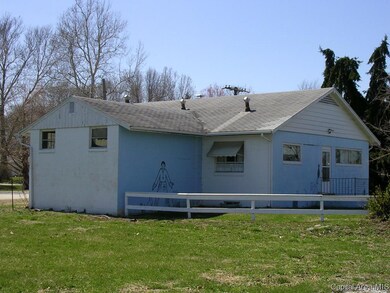
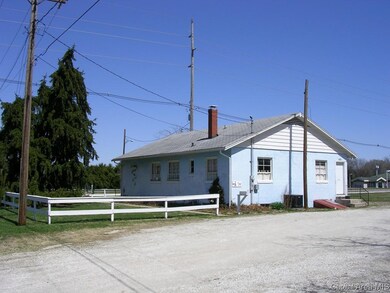
Gross Veterinarian Clinic. Older cinder block building with basement. Lobby, treatment rooms, kennel, offices, storage and full and half baths. Updated HVAC. Lot size is 83X143. 2013 real estate taxes are $1,857.
Last Agent to Sell the Property
RE/MAX Professionals License #471001747 Listed on: 04/08/2015
Last Buyer's Agent
Charles Grojean
IN BETWEEN OFFICES License #471004447
Property Type
Other
Est. Annual Taxes
$3,228
Lot Details
0
| Date | Buyer | Sale Price | Title Company |
|---|---|---|---|
| Whalen Richard E | $17,500 | None Available |
| Date | Event | Price | List to Sale | Price per Sq Ft |
|---|---|---|---|---|
| 10/01/2015 10/01/15 | Sold | $17,500 | -63.2% | $10 / Sq Ft |
| 09/17/2015 09/17/15 | Pending | -- | -- | -- |
| 04/08/2015 04/08/15 | For Sale | $47,500 | -- | $27 / Sq Ft |
| Year | Tax Paid | Tax Assessment Tax Assessment Total Assessment is a certain percentage of the fair market value that is determined by local assessors to be the total taxable value of land and additions on the property. | Land | Improvement |
|---|---|---|---|---|
| 2024 | $3,228 | $37,100 | $5,510 | $31,590 |
| 2023 | $3,509 | $37,220 | $5,510 | $31,710 |
| 2022 | $3,546 | $37,220 | $5,510 | $31,710 |
| 2021 | $3,472 | $37,220 | $5,510 | $31,710 |
| 2020 | $3,406 | $35,780 | $5,510 | $30,270 |
| 2019 | $3,380 | $35,780 | $5,510 | $30,270 |
| 2018 | $3,260 | $35,780 | $5,510 | $30,270 |
| 2017 | $3,189 | $35,780 | $5,510 | $30,270 |
| 2016 | $473 | $5,250 | $5,250 | $0 |
| 2015 | $467 | $5,100 | $5,100 | $0 |
| 2014 | $467 | $21,480 | $5,100 | $16,380 |
| 2013 | $1,856 | $21,480 | $5,100 | $16,380 |
Seller's Agent in 2015
Ronald Duff
RE/MAX Professionals
(217) 652-6025
4 in this area
109 Total Sales
C
Buyer's Agent in 2015
Charles Grojean
IN BETWEEN OFFICES
Source: RMLS Alliance
MLS Number: RMACA151811
APN: 09-18-413-001
Disclaimer: Certain information contained herein is derived from information provided by parties other than Homes.com. All information provided is deemed reliable, but is not guaranteed to be accurate and should be independently verified.
![]() IDX information is provided exclusively for personal, non-commercial use, and may not be used for any purpose other than to identify prospective properties consumers may be interested in purchasing. Information is deemed reliable but not guaranteed.
IDX information is provided exclusively for personal, non-commercial use, and may not be used for any purpose other than to identify prospective properties consumers may be interested in purchasing. Information is deemed reliable but not guaranteed.