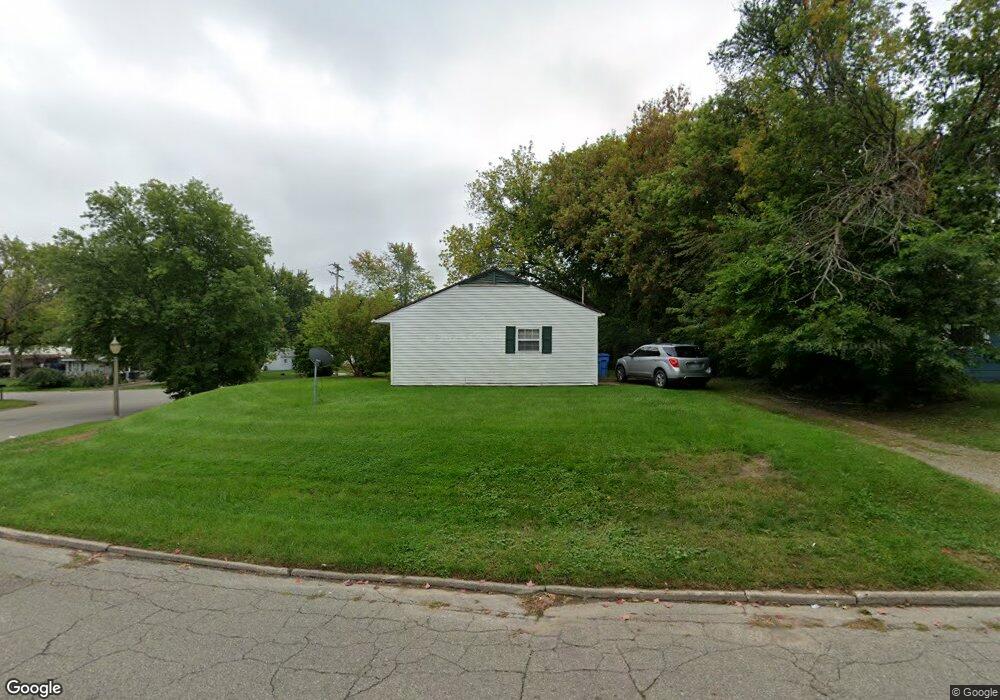
1215 Warwick Dr Lansing, MI 48910
Pleasant Grove NeighborhoodEstimated Value: $74,000 - $100,000
--
Bed
--
Bath
707
Sq Ft
$125/Sq Ft
Est. Value
About This Home
This home is located at 1215 Warwick Dr, Lansing, MI 48910 and is currently estimated at $88,209, approximately $124 per square foot. 1215 Warwick Dr is a home located in Ingham County with nearby schools including Reo Elementary School, Attwood School, and Everett High School.
Ownership History
Date
Name
Owned For
Owner Type
Purchase Details
Closed on
Jul 12, 2024
Sold by
Melecio R And Rachel Meza Living Trust and Meza Melecio R
Bought by
Meza Melecio R and Meza Rachel
Current Estimated Value
Purchase Details
Closed on
Oct 15, 2014
Sold by
Meza Melccio R and Meza Rachel
Bought by
The Melecio R And Rachel Meza Living Tru
Purchase Details
Closed on
Feb 5, 2002
Sold by
Hud
Bought by
Meza Melecio R and Meza Rachel
Purchase Details
Closed on
Oct 26, 2001
Sold by
Citimortgage Inc
Bought by
Hud
Purchase Details
Closed on
Jan 18, 2001
Sold by
Humbert Kenneth
Bought by
Citimortgage Inc
Purchase Details
Closed on
Mar 1, 2000
Sold by
Pentz Carol S and Pentz Raymond J
Bought by
Humbert Kenneth
Home Financials for this Owner
Home Financials are based on the most recent Mortgage that was taken out on this home.
Original Mortgage
$44,413
Interest Rate
8.26%
Mortgage Type
FHA
Purchase Details
Closed on
May 6, 1996
Sold by
Fay Gerald
Bought by
Pentz Stanley
Create a Home Valuation Report for This Property
The Home Valuation Report is an in-depth analysis detailing your home's value as well as a comparison with similar homes in the area
Home Values in the Area
Average Home Value in this Area
Purchase History
| Date | Buyer | Sale Price | Title Company |
|---|---|---|---|
| Meza Melecio R | -- | None Listed On Document | |
| The Melecio R And Rachel Meza Living Tru | -- | None Available | |
| Meza Melecio R | $39,500 | -- | |
| Hud | $49,405 | -- | |
| Citimortgage Inc | $49,405 | -- | |
| Humbert Kenneth | $45,000 | Metropolitan Title Company | |
| Pentz Stanley | $28,000 | -- |
Source: Public Records
Mortgage History
| Date | Status | Borrower | Loan Amount |
|---|---|---|---|
| Previous Owner | Humbert Kenneth | $44,413 |
Source: Public Records
Tax History Compared to Growth
Tax History
| Year | Tax Paid | Tax Assessment Tax Assessment Total Assessment is a certain percentage of the fair market value that is determined by local assessors to be the total taxable value of land and additions on the property. | Land | Improvement |
|---|---|---|---|---|
| 2025 | $1,866 | $33,700 | $6,400 | $27,300 |
| 2024 | $15 | $29,500 | $6,400 | $23,100 |
| 2023 | $1,758 | $26,100 | $6,400 | $19,700 |
| 2022 | $1,608 | $24,600 | $6,400 | $18,200 |
| 2021 | $1,571 | $22,300 | $4,800 | $17,500 |
| 2020 | $1,559 | $21,100 | $4,800 | $16,300 |
| 2019 | $1,504 | $21,000 | $4,800 | $16,200 |
| 2018 | $1,429 | $18,000 | $4,800 | $13,200 |
| 2017 | $1,374 | $18,000 | $4,800 | $13,200 |
| 2016 | $1,382 | $17,700 | $4,800 | $12,900 |
| 2015 | $1,382 | $17,300 | $9,524 | $7,776 |
| 2014 | $1,382 | $17,900 | $12,500 | $5,400 |
Source: Public Records
Map
Nearby Homes
- 1301 Warwick Dr
- 1321 Pompton Cir
- 1113 Eaton Ct
- 0 Eaton Ct
- VL Hillcrest St
- 4221 S Martin Luther King Junior Blvd
- 0 Burchfield Dr
- 3705 Burchfield Dr
- 3820 Lowcroft Ave
- 4114 Burchfield Dr
- 1422 Pierce Rd
- 715 W Holmes Rd
- 1500 Pierce Rd
- 4004 Lowcroft Ave
- 4414 S Martin Luther King jr Blvd
- 1429 Pierce Rd
- 3801 Schlee St
- 4125 Lowcroft Ave
- 1420 Reo Rd
- 4407 Burchfield Ave
- 1223 Warwick Dr
- 1227 Warwick Dr
- 1204 Pompton Cir
- 1216 Warwick Dr
- 1222 Warwick Dr
- 1212 Warwick Dr
- 1124 Warwick Dr
- 1231 Warwick Dr
- 1206 Warwick Dr
- 1208 Pompton Cir
- 1228 Warwick Dr
- 1210 Warwick Dr
- 1125 Warwick Dr
- 1237 Warwick Dr
- 1228 Pompton Cir
- 1232 Warwick Dr
- 1232 Pompton Cir
- 1209 Pompton Cir
- 1216 Pompton Cir
- 1241 Warwick Dr