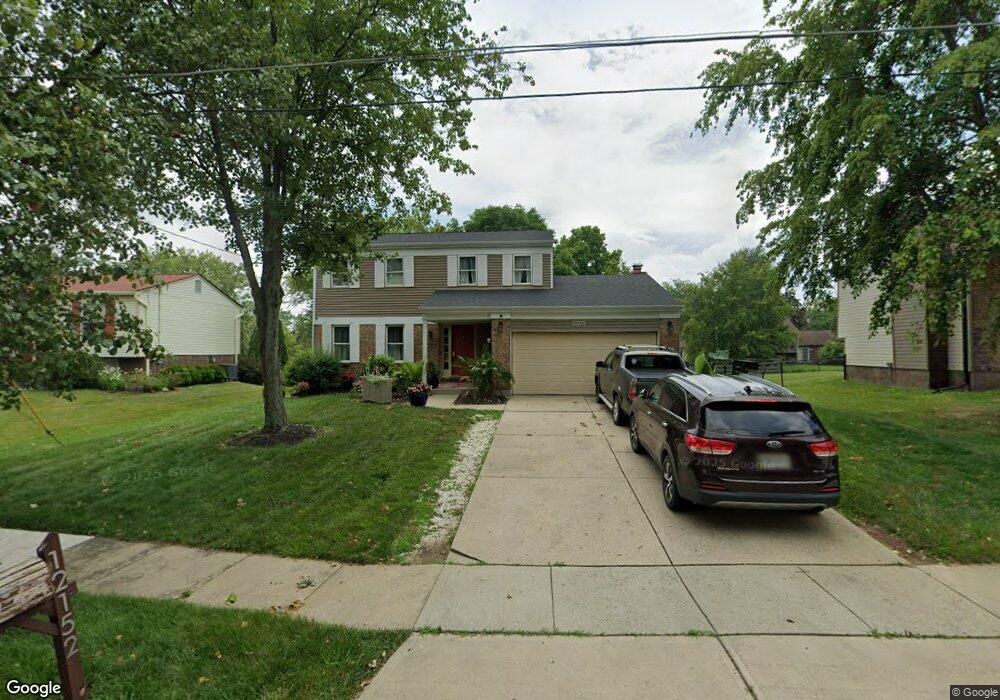
12152 Cedarbreaks Ln Cincinnati, OH 45249
Highpoint NeighborhoodEstimated Value: $336,307 - $369,000
4
Beds
3
Baths
1,721
Sq Ft
$205/Sq Ft
Est. Value
About This Home
This home is located at 12152 Cedarbreaks Ln, Cincinnati, OH 45249 and is currently estimated at $352,077, approximately $204 per square foot. 12152 Cedarbreaks Ln is a home located in Hamilton County with nearby schools including Stewart Elementary School, Princeton Community Middle School, and Princeton High School.
Ownership History
Date
Name
Owned For
Owner Type
Purchase Details
Closed on
Jul 20, 2011
Sold by
Boutelle David A and Boutelle Amy M
Bought by
Ortega Angelica M
Current Estimated Value
Home Financials for this Owner
Home Financials are based on the most recent Mortgage that was taken out on this home.
Original Mortgage
$154,934
Outstanding Balance
$100,043
Interest Rate
3.25%
Mortgage Type
FHA
Estimated Equity
$252,034
Purchase Details
Closed on
May 23, 1998
Sold by
Neal Michael Ray and Neal Marsha Ellen
Bought by
Boutelle David A and Boutelle Amy M
Purchase Details
Closed on
Apr 28, 1995
Sold by
Hamann Glen E and Hamann Deborah A
Bought by
Neal Michael Ray and Neal Marsha Ellen
Home Financials for this Owner
Home Financials are based on the most recent Mortgage that was taken out on this home.
Original Mortgage
$94,150
Interest Rate
8.42%
Create a Home Valuation Report for This Property
The Home Valuation Report is an in-depth analysis detailing your home's value as well as a comparison with similar homes in the area
Home Values in the Area
Average Home Value in this Area
Purchase History
| Date | Buyer | Sale Price | Title Company |
|---|---|---|---|
| Ortega Angelica M | $160,000 | Land Title Agency Inc | |
| Boutelle David A | $128,000 | -- | |
| Neal Michael Ray | -- | -- |
Source: Public Records
Mortgage History
| Date | Status | Borrower | Loan Amount |
|---|---|---|---|
| Open | Ortega Angelica M | $154,934 | |
| Previous Owner | Neal Michael Ray | $94,150 |
Source: Public Records
Tax History Compared to Growth
Tax History
| Year | Tax Paid | Tax Assessment Tax Assessment Total Assessment is a certain percentage of the fair market value that is determined by local assessors to be the total taxable value of land and additions on the property. | Land | Improvement |
|---|---|---|---|---|
| 2024 | $4,101 | $90,374 | $15,225 | $75,149 |
| 2023 | $4,113 | $90,374 | $15,225 | $75,149 |
| 2022 | $3,526 | $62,181 | $11,970 | $50,211 |
| 2021 | $3,431 | $62,181 | $11,970 | $50,211 |
| 2020 | $3,477 | $62,181 | $11,970 | $50,211 |
| 2019 | $3,323 | $54,544 | $10,500 | $44,044 |
| 2018 | $3,141 | $54,544 | $10,500 | $44,044 |
| 2017 | $2,963 | $54,544 | $10,500 | $44,044 |
| 2016 | $3,101 | $57,120 | $10,710 | $46,410 |
| 2015 | $3,133 | $57,120 | $10,710 | $46,410 |
| 2014 | $3,143 | $57,120 | $10,710 | $46,410 |
| 2013 | $3,028 | $56,000 | $10,500 | $45,500 |
Source: Public Records
Map
Nearby Homes
- 7965 Timberbreak Dr
- 9787 Snider Rd
- 12100 Paulmeadows Dr
- 11934 Snider Rd
- 9471 Whippoorwill Ln
- 12152 3rd Ave
- 12109 4th Ave
- 9729 Old Stable Ct
- 9907 Kensington Ln
- 12102 Paulmeadows Dr
- 12121 3rd Ave
- 9609 Cedar Knoll Dr
- 5625 Hunters Lake
- 12173 Crestfield Ct
- 12168 Crestfield Ct
- 12130 Crestfield Ct
- 7199 Fieldstone Ct
- 5819 Deer Run Dr
- 5686 Farm Field Dr
- 5434 Old Farm Dr
- 12146 Cedarbreaks Ln
- 12158 Cedarbreaks Ln
- 12140 Cedarbreaks Ln
- 8136 School Rd
- 8132 School Rd
- 8140 School Rd
- 8128 School Rd
- 12149 Cedarbreaks Ln
- 8111 Fields Ertel Rd
- 12162 Cedarbreaks Ln
- 12143 Cedarbreaks Ln
- 12134 Cedarbreaks Ln
- 8119 Fields Ertel Rd
- 8124 School Rd
- 12166 Cedarbreaks Ln
- 8144 School Rd
- 12172 Cedarbreaks Ln
- 12137 Cedarbreaks Ln
- 12130 Cedarbreaks Ln
- 8120 School Rd