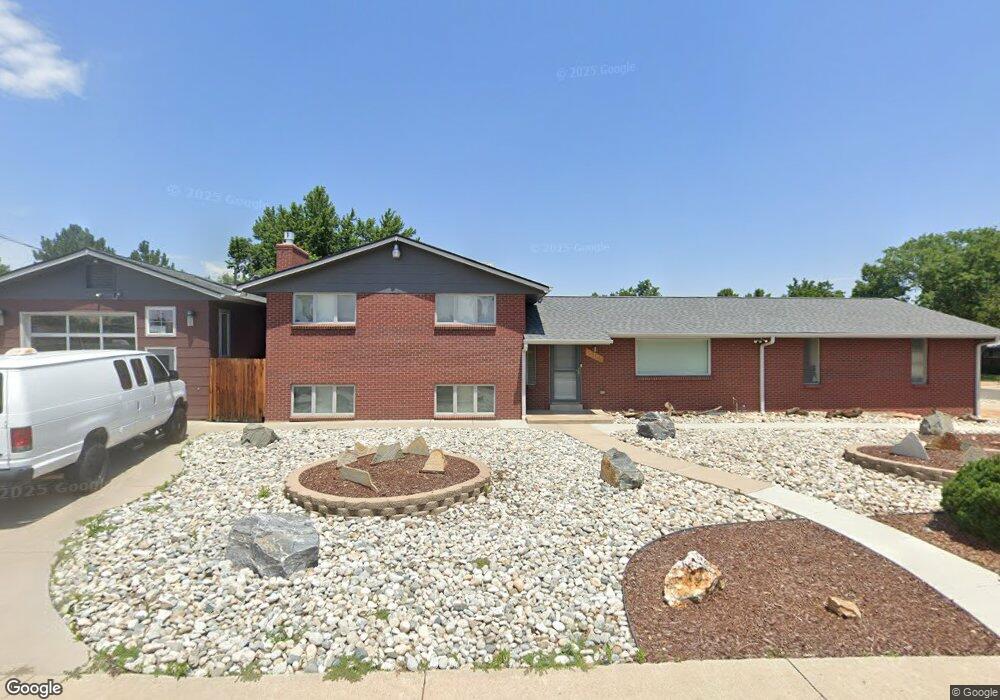
12155 W 35th Ave Wheat Ridge, CO 80033
Applewood Villages NeighborhoodEstimated Value: $781,000 - $894,000
4
Beds
3
Baths
2,162
Sq Ft
$381/Sq Ft
Est. Value
About This Home
This home is located at 12155 W 35th Ave, Wheat Ridge, CO 80033 and is currently estimated at $822,770, approximately $380 per square foot. 12155 W 35th Ave is a home located in Jefferson County with nearby schools including Prospect Valley Elementary School, Everitt Middle School, and Wheat Ridge High School.
Ownership History
Date
Name
Owned For
Owner Type
Purchase Details
Closed on
May 18, 2020
Sold by
Deard David and Estate Of Fred Deard
Bought by
Deard David and Deard Tara
Current Estimated Value
Purchase Details
Closed on
Dec 20, 2019
Sold by
Deard David A
Bought by
Deard David A and Deard Tara L M
Purchase Details
Closed on
Oct 14, 2019
Sold by
Deard David A and The Deard Family Trust
Bought by
Deard David A
Purchase Details
Closed on
Jan 6, 2012
Sold by
The Deard Family Trust
Bought by
Deard Fred
Home Financials for this Owner
Home Financials are based on the most recent Mortgage that was taken out on this home.
Original Mortgage
$100,750
Outstanding Balance
$69,269
Interest Rate
4.04%
Mortgage Type
New Conventional
Estimated Equity
$753,501
Purchase Details
Closed on
Dec 4, 1998
Sold by
Edward Deard Fred
Bought by
The Deard Family Trust
Create a Home Valuation Report for This Property
The Home Valuation Report is an in-depth analysis detailing your home's value as well as a comparison with similar homes in the area
Home Values in the Area
Average Home Value in this Area
Purchase History
| Date | Buyer | Sale Price | Title Company |
|---|---|---|---|
| Deard David | -- | None Available | |
| Deard David A | -- | None Available | |
| Deard David A | -- | None Available | |
| Deard Fred | -- | First American | |
| The Deard Family Trust | -- | -- |
Source: Public Records
Mortgage History
| Date | Status | Borrower | Loan Amount |
|---|---|---|---|
| Open | Deard Fred | $100,750 |
Source: Public Records
Tax History Compared to Growth
Tax History
| Year | Tax Paid | Tax Assessment Tax Assessment Total Assessment is a certain percentage of the fair market value that is determined by local assessors to be the total taxable value of land and additions on the property. | Land | Improvement |
|---|---|---|---|---|
| 2024 | $4,489 | $48,364 | $26,494 | $21,870 |
| 2023 | $4,489 | $48,364 | $26,494 | $21,870 |
| 2022 | $3,764 | $39,621 | $20,746 | $18,875 |
| 2021 | $3,794 | $40,761 | $21,343 | $19,418 |
| 2020 | $2,952 | $31,745 | $11,238 | $20,507 |
| 2019 | $2,257 | $31,745 | $11,238 | $20,507 |
| 2018 | $2,429 | $32,995 | $11,119 | $21,876 |
| 2017 | $2,241 | $32,995 | $11,119 | $21,876 |
| 2016 | $1,694 | $26,364 | $8,152 | $18,212 |
| 2015 | $1,251 | $26,364 | $8,152 | $18,212 |
| 2014 | $1,251 | $20,618 | $7,794 | $12,824 |
Source: Public Records
Map
Nearby Homes
- 12285 W 34th Place
- 11880 W 38th Place
- 3229 Swadley St
- 11760 W 32nd Ave
- 3322 Simms St
- 3310 Routt St
- 11440 W 38th Ave
- 11820 W 30th Place
- 12000 W 29th Place
- 11589 W 39th Ave
- 3815 Quail Ct
- 3935 Pierson St
- 3112 Braun Ct
- 3100 Braun Ct
- 2591 Beech Ct
- 11144 W 27th Ave
- 11340 Benthaven Dr
- 3127 Nelson Ct
- 2615 Oak Dr Unit 40
- 2590 Braun Dr
- 3525 Urban Ct
- 12225 W 35th Ave
- 12180 W 35th Ave
- 3535 Urban Ct
- 12140 W 35th Ave
- 12200 W 35th Ave
- 12125 W 35th Ave
- 12285 W 35th Ave
- 12100 W 35th Ave
- 3520 Urban Ct
- 12270 W 35th Ave
- 3545 Urban Ct
- 3530 Urban Ct
- 12080 W 35th Ave
- 12215 W 34th Place
- 12290 W 35th Ave
- 12185 W 34th Place
- 12235 W 34th Place
- 3540 Urban Ct
- 12395 W 35th Ave