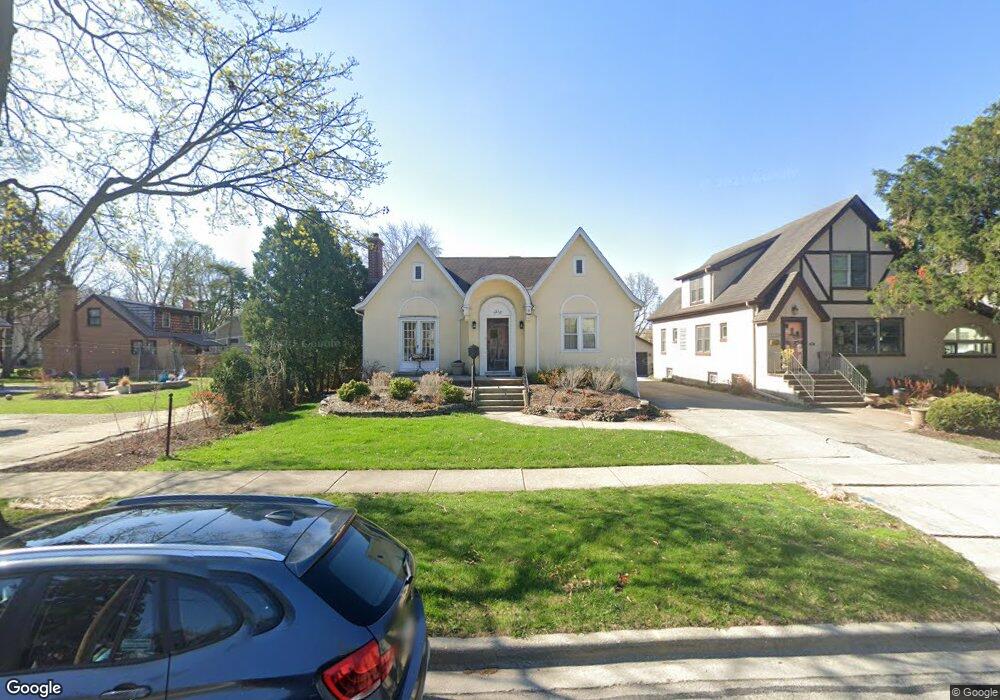
1216 41st St La Grange, IL 60525
Estimated Value: $747,842 - $890,000
4
Beds
1
Bath
2,087
Sq Ft
$390/Sq Ft
Est. Value
About This Home
This home is located at 1216 41st St, La Grange, IL 60525 and is currently estimated at $814,461, approximately $390 per square foot. 1216 41st St is a home located in Cook County with nearby schools including Ogden Ave Elementary School, Park Junior High School, and Lyons Township High School.
Ownership History
Date
Name
Owned For
Owner Type
Purchase Details
Closed on
Jan 12, 2023
Sold by
Clark Maura A
Bought by
Maura A Clark Living Trust
Current Estimated Value
Purchase Details
Closed on
Sep 22, 2006
Sold by
Urycki Richard and Urycki Sarah S
Bought by
Clark Maura A
Home Financials for this Owner
Home Financials are based on the most recent Mortgage that was taken out on this home.
Original Mortgage
$325,000
Interest Rate
6.49%
Mortgage Type
Unknown
Purchase Details
Closed on
Apr 25, 1996
Sold by
American National Bk & Tr Co Of Chicago
Bought by
Urycki Richard and Urycki Sarah S
Home Financials for this Owner
Home Financials are based on the most recent Mortgage that was taken out on this home.
Original Mortgage
$141,000
Interest Rate
7.86%
Mortgage Type
FHA
Create a Home Valuation Report for This Property
The Home Valuation Report is an in-depth analysis detailing your home's value as well as a comparison with similar homes in the area
Home Values in the Area
Average Home Value in this Area
Purchase History
| Date | Buyer | Sale Price | Title Company |
|---|---|---|---|
| Maura A Clark Living Trust | -- | None Listed On Document | |
| Clark Maura A | $530,000 | First American Title | |
| Urycki Richard | $177,000 | -- |
Source: Public Records
Mortgage History
| Date | Status | Borrower | Loan Amount |
|---|---|---|---|
| Previous Owner | Clark Maura A | $325,000 | |
| Previous Owner | Urycki Richard | $141,000 |
Source: Public Records
Tax History Compared to Growth
Tax History
| Year | Tax Paid | Tax Assessment Tax Assessment Total Assessment is a certain percentage of the fair market value that is determined by local assessors to be the total taxable value of land and additions on the property. | Land | Improvement |
|---|---|---|---|---|
| 2024 | $12,163 | $55,000 | $9,130 | $45,870 |
| 2023 | $10,156 | $55,000 | $9,130 | $45,870 |
| 2022 | $10,156 | $40,747 | $7,470 | $33,277 |
| 2021 | $10,553 | $40,746 | $7,470 | $33,276 |
| 2020 | $10,392 | $40,746 | $7,470 | $33,276 |
| 2019 | $12,769 | $49,714 | $6,847 | $42,867 |
| 2018 | $12,524 | $49,714 | $6,847 | $42,867 |
| 2017 | $12,209 | $49,714 | $6,847 | $42,867 |
| 2016 | $11,622 | $42,216 | $6,017 | $36,199 |
| 2015 | $10,829 | $42,216 | $6,017 | $36,199 |
| 2014 | $10,673 | $42,216 | $6,017 | $36,199 |
| 2013 | $11,436 | $45,917 | $6,017 | $39,900 |
Source: Public Records
Map
Nearby Homes
- 20 N Edgewood Ave
- 1105 W Hillgrove Ave Unit 4
- 48 N Park Rd
- 17-19 N Brainard Ave
- 141 N Peck Ave
- 709 Bell Ave
- 33 N Stone Ave
- 3900 Gilbert Ave
- 4016 Linden Ave
- 3927 Linden Ave
- 4235 Clausen Ave
- 27 S Waiola Ave Unit 103
- 518 W Cossitt Ave
- 4019 Howard Ave
- 4443 Howard Ave
- 4320 Howard Ave
- 4468 Clausen Ave
- 405 S Gilbert Ave
- 4100 Franklin Ave
- 4537 Clausen Ave