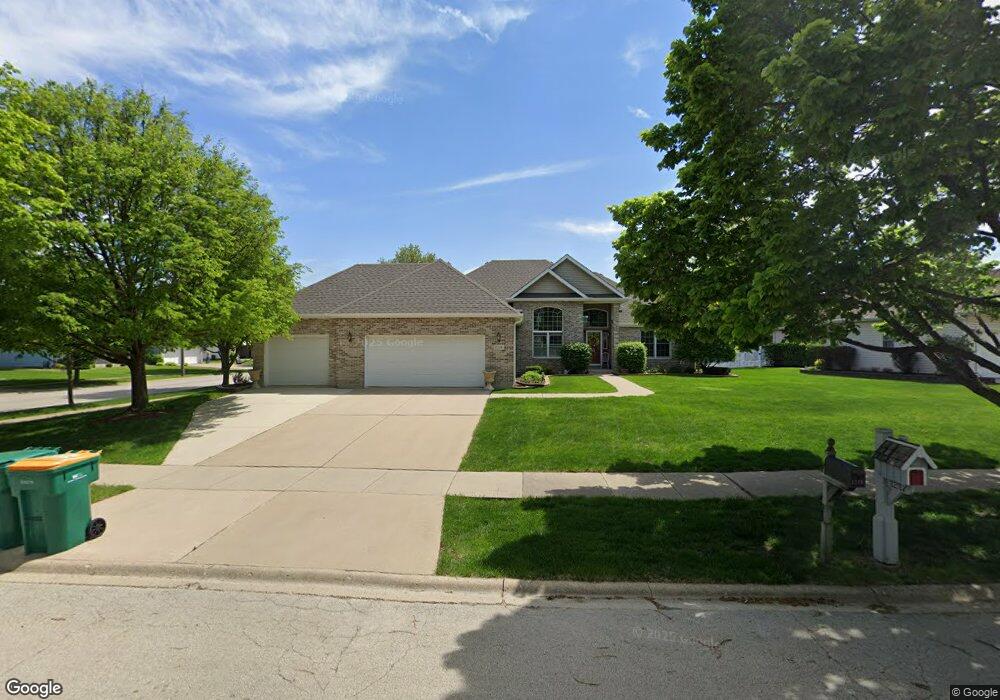
1216 Barber Ln Joliet, IL 60435
Southwest Joliet NeighborhoodEstimated Value: $348,136 - $403,000
--
Bed
1
Bath
1,862
Sq Ft
$207/Sq Ft
Est. Value
About This Home
This home is located at 1216 Barber Ln, Joliet, IL 60435 and is currently estimated at $385,034, approximately $206 per square foot. 1216 Barber Ln is a home located in Will County with nearby schools including Troy Craughwell Elementary School, Troy Middle School, and Orenic Intermediate School.
Ownership History
Date
Name
Owned For
Owner Type
Purchase Details
Closed on
Sep 27, 1996
Sold by
Bell Grant E
Bought by
Ohara William B and Ohara Marilyn L
Current Estimated Value
Home Financials for this Owner
Home Financials are based on the most recent Mortgage that was taken out on this home.
Original Mortgage
$100,000
Outstanding Balance
$9,108
Interest Rate
8%
Estimated Equity
$375,926
Purchase Details
Closed on
Jun 5, 1996
Sold by
Simonic Ronald M
Bought by
Bell Grant E
Home Financials for this Owner
Home Financials are based on the most recent Mortgage that was taken out on this home.
Original Mortgage
$134,400
Interest Rate
8%
Purchase Details
Closed on
May 30, 1996
Sold by
First National Bank Of Joliet
Bought by
Simonic Ronald
Home Financials for this Owner
Home Financials are based on the most recent Mortgage that was taken out on this home.
Original Mortgage
$134,400
Interest Rate
8%
Create a Home Valuation Report for This Property
The Home Valuation Report is an in-depth analysis detailing your home's value as well as a comparison with similar homes in the area
Home Values in the Area
Average Home Value in this Area
Purchase History
| Date | Buyer | Sale Price | Title Company |
|---|---|---|---|
| Ohara William B | $169,000 | -- | |
| Bell Grant E | $39,000 | -- | |
| Simonic Ronald | $22,000 | -- |
Source: Public Records
Mortgage History
| Date | Status | Borrower | Loan Amount |
|---|---|---|---|
| Open | Ohara William B | $100,000 | |
| Previous Owner | Bell Grant E | $134,400 |
Source: Public Records
Tax History Compared to Growth
Tax History
| Year | Tax Paid | Tax Assessment Tax Assessment Total Assessment is a certain percentage of the fair market value that is determined by local assessors to be the total taxable value of land and additions on the property. | Land | Improvement |
|---|---|---|---|---|
| 2024 | $8,792 | $116,138 | $28,937 | $87,201 |
| 2023 | $8,792 | $104,347 | $25,999 | $78,348 |
| 2022 | $8,143 | $98,739 | $24,602 | $74,137 |
| 2021 | $7,609 | $92,887 | $23,144 | $69,743 |
| 2020 | $7,619 | $92,887 | $23,144 | $69,743 |
| 2019 | $7,372 | $89,100 | $22,200 | $66,900 |
| 2018 | $7,461 | $87,700 | $24,750 | $62,950 |
| 2017 | $7,289 | $84,500 | $24,750 | $59,750 |
| 2016 | $7,615 | $80,050 | $24,750 | $55,300 |
| 2015 | $6,860 | $74,500 | $22,800 | $51,700 |
| 2014 | $6,860 | $70,918 | $22,800 | $48,118 |
| 2013 | $6,860 | $70,918 | $22,800 | $48,118 |
Source: Public Records
Map
Nearby Homes
- 3107 Ingalls Ave Unit 3B
- 3107 Ingalls Ave Unit 1D
- 1112 Rosary Ln
- 3119 Ingalls Ave Unit 2A
- 1219 Cedarwood Dr Unit B
- 1099 Gael Dr
- 2558 Grant Park Ct Unit 21
- 1422 Citadel Dr Unit 4
- 3001 Theodore St
- 1125 Magnolia Dr
- 816 Rosary Ln
- 812 Cassie Dr
- 7 Rock Run Dr
- 8 Rock Run Dr
- Lot 48 Murphy Dr
- 2858 Arden Place
- 2390 Bicentennial Ave
- 712 Sanctuary Ln
- 1802 Maserati Dr
- 710 Sanctuary Ln
- 1209 Pleasant Knoll Dr
- 1212 Pleasant Knoll Dr
- 1217 Barber Ln
- 1212 Barber Ln
- 1210 Pleasant Knoll Dr
- 1214 Pleasant Knoll Dr
- 2914 Hintze Ct
- 1319 Cassie Dr
- 2916 Hintze Ct
- 1208 Pleasant Knoll Dr
- 1216 Pleasant Knoll Dr
- 1210 Barber Ln
- 1206 Pleasant Knoll Dr
- 1317 Cassie Dr
- 2912 Hintze Ct Unit 3
- 1300 Pleasant Knoll Ct Unit 1
- 1213 Barber Ln
- 1303 Pleasant Knoll Ct Unit 1
- 1208 Barber Ln
- 1204 Pleasant Knoll Dr