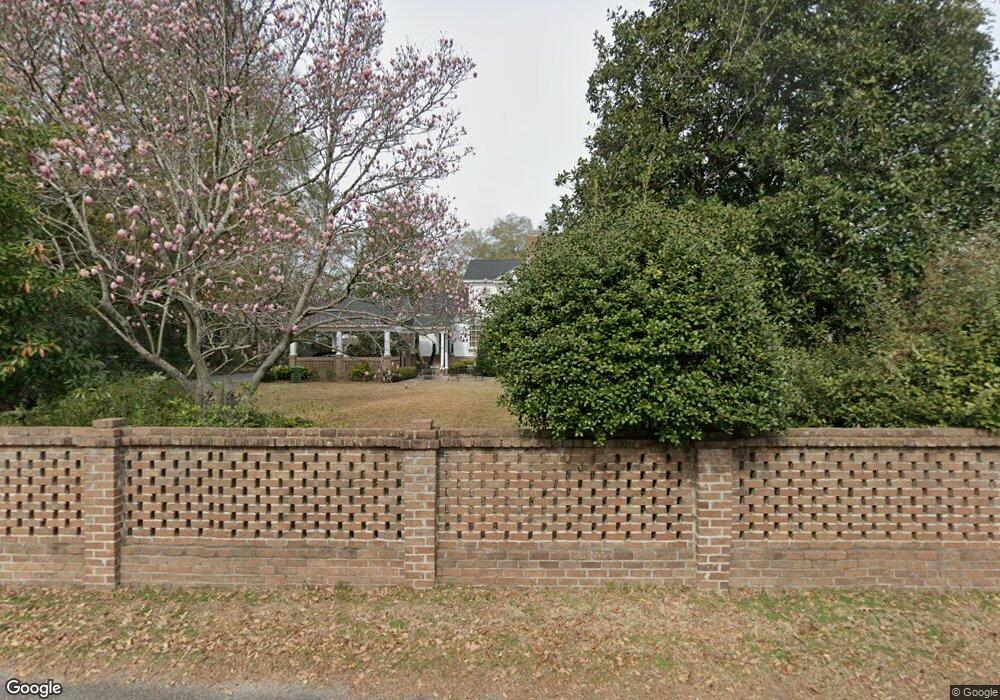
1216 Cherokee Rd Florence, SC 29501
Estimated Value: $369,000 - $506,333
4
Beds
3
Baths
3,680
Sq Ft
$118/Sq Ft
Est. Value
About This Home
This home is located at 1216 Cherokee Rd, Florence, SC 29501 and is currently estimated at $434,583, approximately $118 per square foot. 1216 Cherokee Rd is a home located in Florence County with nearby schools including Briggs Elementary School, Henry L. Sneed Middle School, and John W. Moore Middle School.
Ownership History
Date
Name
Owned For
Owner Type
Purchase Details
Closed on
Jul 12, 2007
Sold by
Kahn Celeste P
Bought by
Kahn Celeste Padgett and Celeste Padgett Kahn Trust
Current Estimated Value
Purchase Details
Closed on
Jan 17, 2007
Sold by
Qtip Padgett Jr Clyde T and Qtip Clyde Talmadge Padgett Jr
Bought by
Kahn Celeste P
Home Financials for this Owner
Home Financials are based on the most recent Mortgage that was taken out on this home.
Original Mortgage
$200,000
Outstanding Balance
$118,586
Interest Rate
6.07%
Mortgage Type
Purchase Money Mortgage
Estimated Equity
$315,997
Purchase Details
Closed on
Jun 14, 2005
Sold by
Padge Padgett Jr Clyde T and Padge Elizabeth Holliday Allen
Bought by
Qtip Padgett Jr Clyde T and Qtip Clyde Talmadge Padgett Jr
Purchase Details
Closed on
Oct 25, 2004
Sold by
Padgett Clyde T and Estate Of Elizabeth A Padgett
Bought by
Padge Padgett Jr Clyde T and Padge Elizabeth Holliday Allen
Create a Home Valuation Report for This Property
The Home Valuation Report is an in-depth analysis detailing your home's value as well as a comparison with similar homes in the area
Home Values in the Area
Average Home Value in this Area
Purchase History
| Date | Buyer | Sale Price | Title Company |
|---|---|---|---|
| Kahn Celeste Padgett | -- | Attorney | |
| Kahn Celeste P | $200,000 | None Available | |
| Qtip Padgett Jr Clyde T | -- | -- | |
| Padge Padgett Jr Clyde T | -- | -- |
Source: Public Records
Mortgage History
| Date | Status | Borrower | Loan Amount |
|---|---|---|---|
| Open | Kahn Celeste P | $200,000 |
Source: Public Records
Tax History Compared to Growth
Tax History
| Year | Tax Paid | Tax Assessment Tax Assessment Total Assessment is a certain percentage of the fair market value that is determined by local assessors to be the total taxable value of land and additions on the property. | Land | Improvement |
|---|---|---|---|---|
| 2024 | $1,476 | $16,817 | $2,600 | $14,217 |
| 2023 | $1,334 | $12,516 | $2,600 | $9,916 |
| 2022 | $1,466 | $12,516 | $2,600 | $9,916 |
| 2021 | $1,639 | $12,520 | $0 | $0 |
| 2020 | $1,437 | $12,520 | $0 | $0 |
| 2019 | $1,338 | $12,516 | $2,600 | $9,916 |
| 2018 | $1,276 | $12,520 | $0 | $0 |
| 2017 | $1,208 | $12,520 | $0 | $0 |
| 2016 | $1,142 | $12,520 | $0 | $0 |
| 2015 | $1,198 | $12,580 | $0 | $0 |
| 2014 | $1,035 | $12,579 | $2,600 | $9,979 |
Source: Public Records
Map
Nearby Homes
- 904 Beverly Dr
- 1713 Cherokee Rd
- 1007 S Edisto Dr
- 1001 Lindberg Dr
- 1404 Cherokee Rd
- 906 Sherwood Dr
- 1024 Woodstone Dr
- 1400 Jackson Ave
- 906 Cherokee Rd
- 1211 Jackson Ave
- 916 Kalmia St
- 1505 Tanglewood Cir
- 965 Scriven Dr
- 1315 Madison Ave
- 1152 Brunwood Dr
- 1306 W Palmetto St
- 818 Lynwood Dr
- 1016 Madison Ave
- 600 Greenway Dr
- 1602 Cherokee Rd
- 1210 Cherokee Rd
- 1300 Cherokee Rd
- 1211 Cherokee Rd
- 1204 Cherokee Rd
- 814 S Edisto Dr
- 811 S Edisto Dr
- 713 S Edisto Dr
- 813 S Edisto Dr
- 1306 Cherokee Rd
- 711 S Edisto Dr
- 900 S Edisto Dr
- 1 N Edisto Dr
- 901 Alton Cir
- 815 S Edisto Dr
- 1305 Cherokee Rd
- 904 S Edisto Dr
- 1310 Cherokee Rd
- 900 Alton Cir
- 1307 Cherokee Rd
- 1300 Sewanee Ave