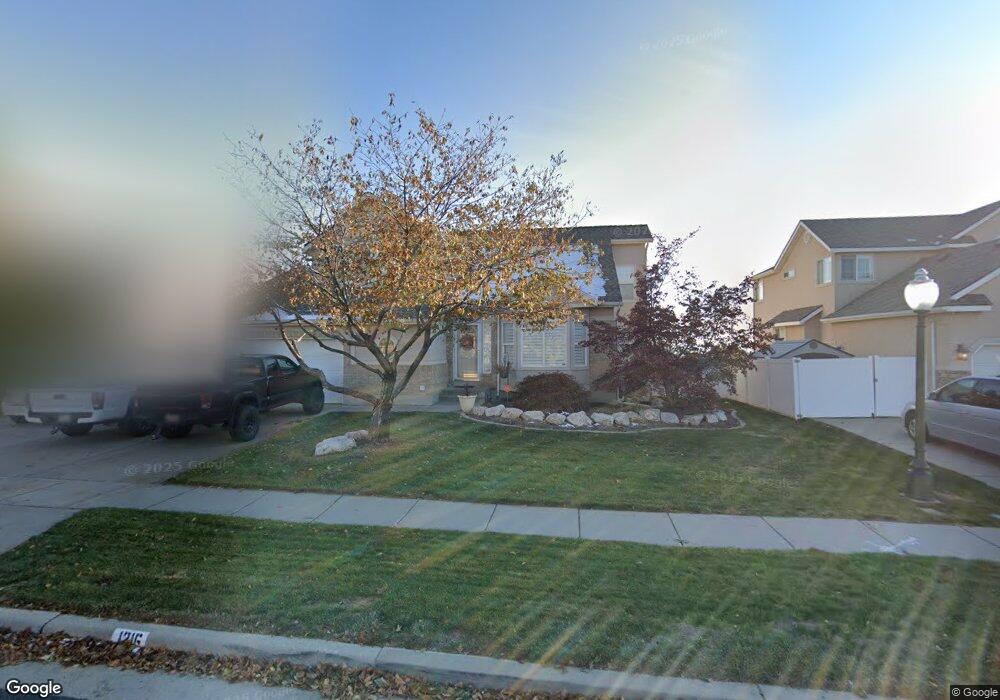
1216 E 2675 N Layton, UT 84040
Estimated Value: $523,000 - $603,000
3
Beds
3
Baths
2,213
Sq Ft
$253/Sq Ft
Est. Value
About This Home
This home is located at 1216 E 2675 N, Layton, UT 84040 and is currently estimated at $559,509, approximately $252 per square foot. 1216 E 2675 N is a home located in Davis County with nearby schools including Sarah Jane Adams Elementary School, North Layton Junior High School, and Northridge High School.
Ownership History
Date
Name
Owned For
Owner Type
Purchase Details
Closed on
Nov 20, 2017
Sold by
Cooper Jan and Cooper Susan K
Bought by
Cooper Jan and Cooper Revocable Living Trust
Current Estimated Value
Purchase Details
Closed on
Nov 23, 1998
Sold by
Gmw Development Inc
Bought by
Cooper Jan and Cooper Susan K
Home Financials for this Owner
Home Financials are based on the most recent Mortgage that was taken out on this home.
Original Mortgage
$192,931
Interest Rate
6.84%
Purchase Details
Closed on
Jul 22, 1998
Sold by
Belleau Wayne A
Bought by
Gmw Development Inc
Create a Home Valuation Report for This Property
The Home Valuation Report is an in-depth analysis detailing your home's value as well as a comparison with similar homes in the area
Home Values in the Area
Average Home Value in this Area
Purchase History
| Date | Buyer | Sale Price | Title Company |
|---|---|---|---|
| Cooper Jan | -- | -- | |
| Cooper Jan | -- | Bonneville Title Company Inc | |
| Gmw Development Inc | -- | Bonneville Title Company Inc | |
| Gmw Development Inc | -- | Bonneville Title Company |
Source: Public Records
Mortgage History
| Date | Status | Borrower | Loan Amount |
|---|---|---|---|
| Previous Owner | Cooper Jan | $192,931 |
Source: Public Records
Tax History
| Year | Tax Paid | Tax Assessment Tax Assessment Total Assessment is a certain percentage of the fair market value that is determined by local assessors to be the total taxable value of land and additions on the property. | Land | Improvement |
|---|---|---|---|---|
| 2025 | $3,117 | $300,850 | $121,001 | $179,849 |
| 2024 | $2,903 | $283,800 | $145,426 | $138,374 |
| 2023 | $2,897 | $505,000 | $197,425 | $307,575 |
| 2022 | $2,926 | $278,300 | $105,780 | $172,520 |
| 2021 | $2,703 | $383,000 | $160,798 | $222,202 |
| 2020 | $2,532 | $344,000 | $129,449 | $214,551 |
| 2019 | $2,388 | $319,000 | $115,799 | $203,201 |
| 2018 | $2,192 | $294,000 | $73,727 | $220,273 |
| 2016 | $2,108 | $148,665 | $36,236 | $112,429 |
| 2015 | $2,151 | $145,090 | $36,236 | $108,854 |
| 2014 | $2,221 | $154,326 | $36,236 | $118,090 |
| 2013 | -- | $151,137 | $43,025 | $108,112 |
Source: Public Records
Map
Nearby Homes
- 1447 E 2700 N
- 948 E Hercules Ct Unit 179
- 1444 E 2400 N
- 2826 N 1600 E
- 2315 N 1075 E
- 3142 E Thorley Dr
- 3138 E Thorley Dr
- 1241 E 3075 N
- 1266 E 3125 N
- 1731 E 2825 N
- 1120 E 2200 N
- 1321 E 3125 N
- 1785 E 2825 N
- 3176 N 1450 E
- 1099 E 2125 N
- 935 E 3000 N Unit 183
- 935 E 3000 N Unit 175
- 935 E 3000 N Unit 165
- 935 E 3000 N Unit 26
- 935 E 3000 N Unit 90
Your Personal Tour Guide
Ask me questions while you tour the home.