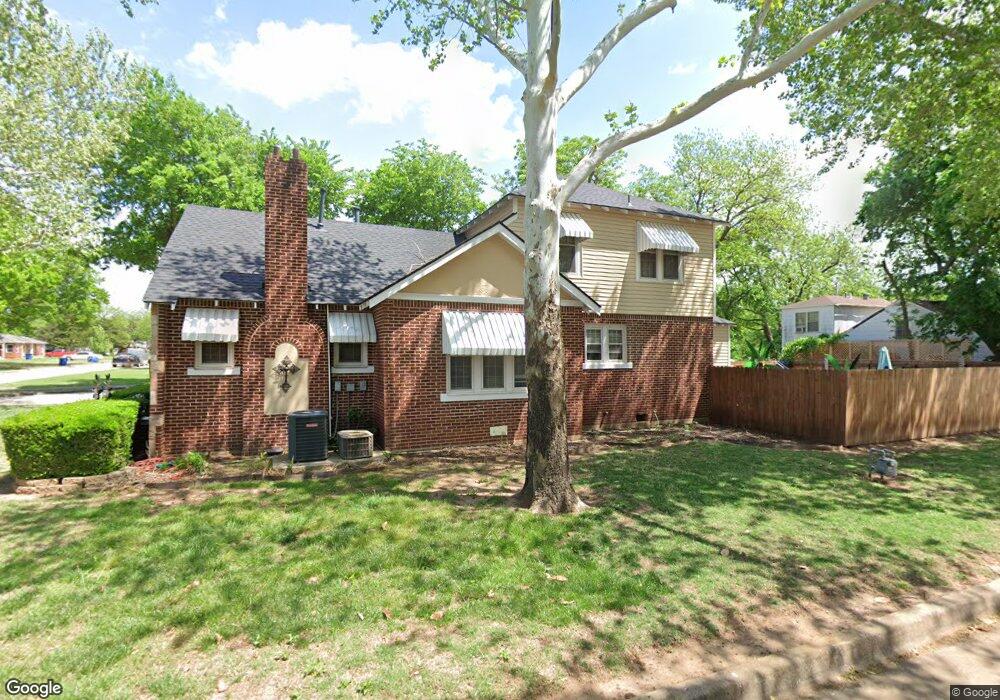
1216 W Cedar Ave Duncan, OK 73533
Estimated Value: $146,000 - $177,000
3
Beds
2
Baths
2,130
Sq Ft
$78/Sq Ft
Est. Value
About This Home
This home is located at 1216 W Cedar Ave, Duncan, OK 73533 and is currently estimated at $165,400, approximately $77 per square foot. 1216 W Cedar Ave is a home located in Stephens County with nearby schools including Emerson Elementary School, Duncan Middle School, and Duncan High School.
Ownership History
Date
Name
Owned For
Owner Type
Purchase Details
Closed on
May 8, 2023
Sold by
Allie Michael W and Allie Gina
Bought by
Ledford Dawson R and Ledford Jennifer L
Current Estimated Value
Purchase Details
Closed on
Oct 27, 2017
Sold by
Nelson Cathy R and Allie Dina M
Bought by
Allie Michael W and Allie Gina M
Home Financials for this Owner
Home Financials are based on the most recent Mortgage that was taken out on this home.
Original Mortgage
$117,300
Interest Rate
3.83%
Mortgage Type
New Conventional
Purchase Details
Closed on
May 31, 2012
Sold by
Whetsell Bob and Whetsell Patricia
Bought by
Nelson Cathy R and Bidigare Gina
Purchase Details
Closed on
Apr 14, 2003
Sold by
Boon Lillian
Purchase Details
Closed on
Oct 17, 1995
Sold by
Green Michael L
Purchase Details
Closed on
Aug 16, 1993
Sold by
Local Federal Savings
Create a Home Valuation Report for This Property
The Home Valuation Report is an in-depth analysis detailing your home's value as well as a comparison with similar homes in the area
Purchase History
| Date | Buyer | Sale Price | Title Company |
|---|---|---|---|
| Ledford Dawson R | $110,500 | Old Republic Title | |
| Allie Michael W | -- | Timios Inc | |
| Nelson Cathy R | $80,000 | None Available | |
| Nelson Cathy R | -- | None Available | |
| -- | $68,000 | -- | |
| -- | $65,000 | -- | |
| -- | -- | -- |
Source: Public Records
Mortgage History
| Date | Status | Borrower | Loan Amount |
|---|---|---|---|
| Previous Owner | Allie Michael W | $117,300 |
Source: Public Records
Tax History
| Year | Tax Paid | Tax Assessment Tax Assessment Total Assessment is a certain percentage of the fair market value that is determined by local assessors to be the total taxable value of land and additions on the property. | Land | Improvement |
|---|---|---|---|---|
| 2025 | $1,245 | $14,758 | $674 | $14,084 |
| 2024 | $1,140 | $13,386 | $674 | $12,712 |
| 2023 | $1,140 | $13,386 | $674 | $12,712 |
| 2022 | $1,032 | $12,749 | $674 | $12,075 |
| 2021 | $1,034 | $12,142 | $674 | $11,468 |
| 2020 | $951 | $11,013 | $674 | $10,339 |
| 2019 | $907 | $10,489 | $674 | $9,815 |
| 2018 | $890 | $9,989 | $674 | $9,315 |
| 2017 | $864 | $10,051 | $674 | $9,377 |
| 2016 | $825 | $9,710 | $674 | $9,036 |
| 2015 | $708 | $9,485 | $674 | $8,811 |
| 2014 | $708 | $9,632 | $583 | $9,049 |
Source: Public Records
Map
Nearby Homes
- 1213 W Pine Ave
- 1312 W Pine Ave
- 815 N 14th St
- 1275 N 10th St
- 905 W Pine Ave
- 1105 N Grand Blvd
- 1105 W Beech Ave
- 1314 W Beech Ave
- 1112 1112 N 12th
- 1106 W Ash Ave
- 1202 N Grand Blvd
- 722 N 8th St
- 809 W Beech Ave
- 1061 N 8th St
- 1203 W Walnut Ave
- 416 N 19th St
- 27 N 14th St
- 1099 N 19th St
- 512 W Pine Ave
- 805 N 5th St
- 712 N 13th St
- 1212 W Cedar Ave
- 1302 W Cedar Ave
- 715 N 13th St
- 713 N 13th St
- 708 N 13th St
- 711 N 13th St
- 1206 W Cedar Ave
- 709 N 13th St
- 706 N 13th St
- 1306 W Cedar Ave
- 1215 W Cedar Ave
- 1211 W Cedar Ave
- 1213 1213 Pine W
- 705 N 13th St
- 1202 W Cedar Ave
- 1209 W Cedar Ave
- 707 N 13th St
- 1209 W Pine Ave
- 1301 W Cedar Ave