12160 Abington Hall Place Unit 103 Reston, VA 20190
Reston Town Center NeighborhoodEstimated Value: $535,000 - $608,000
3
Beds
2
Baths
1,401
Sq Ft
$401/Sq Ft
Est. Value
About This Home
This home is located at 12160 Abington Hall Place Unit 103, Reston, VA 20190 and is currently estimated at $561,839, approximately $401 per square foot. 12160 Abington Hall Place Unit 103 is a home located in Fairfax County with nearby schools including Lake Anne Elementary, Langston Hughes Middle School, and South Lakes High School.
Ownership History
Date
Name
Owned For
Owner Type
Purchase Details
Closed on
Dec 12, 2014
Sold by
Moss Tr Helen F
Bought by
Moss Tr Helen
Current Estimated Value
Purchase Details
Closed on
Dec 22, 2008
Sold by
Co-Exr Susanna S Crowley
Bought by
Moss Trustee Helen F
Home Financials for this Owner
Home Financials are based on the most recent Mortgage that was taken out on this home.
Original Mortgage
$275,000
Interest Rate
6.27%
Mortgage Type
New Conventional
Purchase Details
Closed on
Sep 23, 2003
Sold by
Martin George L
Bought by
Selby Helen C
Purchase Details
Closed on
Jan 27, 2000
Sold by
Madison Park L Lc
Bought by
Martin George L
Home Financials for this Owner
Home Financials are based on the most recent Mortgage that was taken out on this home.
Original Mortgage
$194,150
Interest Rate
7.83%
Create a Home Valuation Report for This Property
The Home Valuation Report is an in-depth analysis detailing your home's value as well as a comparison with similar homes in the area
Home Values in the Area
Average Home Value in this Area
Purchase History
| Date | Buyer | Sale Price | Title Company |
|---|---|---|---|
| Moss Tr Helen | -- | -- | |
| Moss Trustee Helen F | $380,050 | -- | |
| Selby Helen C | $303,000 | -- | |
| Martin George L | $204,380 | -- |
Source: Public Records
Mortgage History
| Date | Status | Borrower | Loan Amount |
|---|---|---|---|
| Previous Owner | Moss Trustee Helen F | $275,000 | |
| Previous Owner | Martin George L | $194,150 |
Source: Public Records
Tax History Compared to Growth
Tax History
| Year | Tax Paid | Tax Assessment Tax Assessment Total Assessment is a certain percentage of the fair market value that is determined by local assessors to be the total taxable value of land and additions on the property. | Land | Improvement |
|---|---|---|---|---|
| 2025 | $6,050 | $493,250 | $99,000 | $394,250 |
| 2024 | $6,050 | $493,250 | $99,000 | $394,250 |
| 2023 | $5,675 | $474,280 | $95,000 | $379,280 |
| 2022 | $5,525 | $456,040 | $91,000 | $365,040 |
| 2021 | $5,444 | $438,500 | $88,000 | $350,500 |
| 2020 | $5,488 | $438,500 | $88,000 | $350,500 |
| 2019 | $5,323 | $425,290 | $85,000 | $340,290 |
| 2018 | $4,706 | $409,200 | $82,000 | $327,200 |
| 2017 | $5,199 | $430,420 | $86,000 | $344,420 |
| 2016 | $5,087 | $421,980 | $84,000 | $337,980 |
| 2015 | $4,908 | $421,980 | $84,000 | $337,980 |
| 2014 | $4,709 | $405,750 | $81,000 | $324,750 |
Source: Public Records
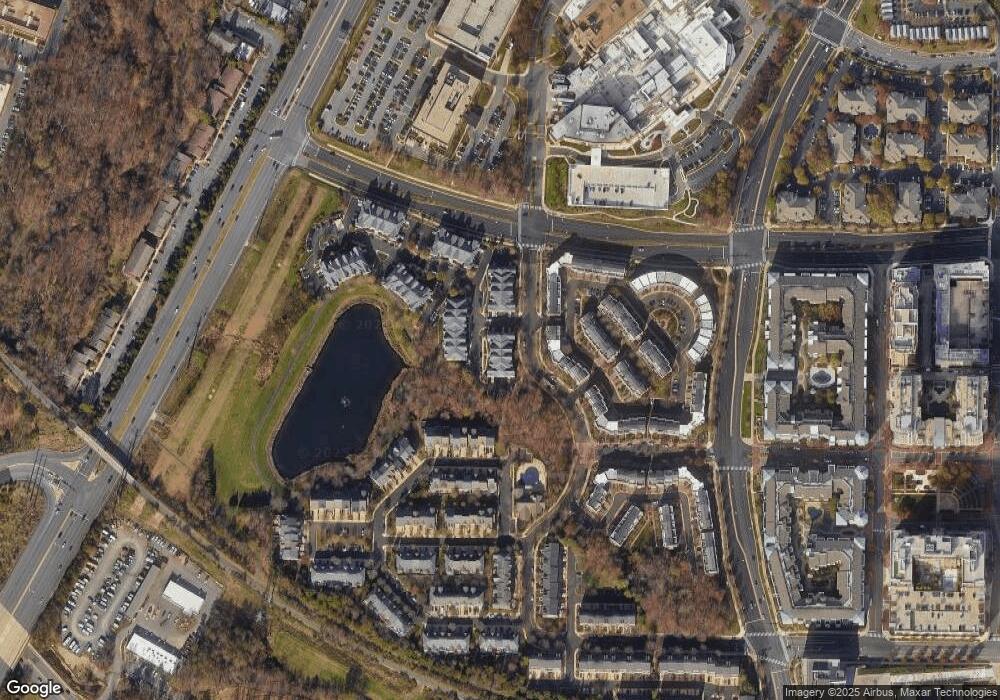
Map
Nearby Homes
- 12161 Abington Hall Place Unit 202
- 12165 Abington Hall Place Unit 302
- 12170 Abington Hall Place Unit 205
- 12185 Abington Hall Place Unit 104
- 1924 Logan Manor Dr
- 12129 Chancery Station Cir
- 12001 Market St Unit 260
- 12001 Market St Unit 319
- 12001 Market St Unit 412
- 12001 Market St Unit T35
- 12000 Market St Unit 110
- 12000 Market St Unit 218
- 12000 Market St Unit 378
- 12000 Market St Unit 232
- 12000 Market St Unit 176
- 12000 Market St Unit 490
- 12000 Market St Unit 324
- 12000 Market St Unit 311
- 11990 Market St Unit 1202
- 11990 Market St Unit 906
- 12160 Abington Hall Place Unit 301
- 12160 Abington Hall Place Unit 304
- 12160 Abington Hall Place Unit 302
- 12160 Abington Hall Place Unit 101
- 12160 Abington Hall Place Unit 201
- 12160 Abington Hall Place Unit 206
- 12160 Abington Hall Place Unit 207
- 12160 Abington Hall Place Unit 203
- 12160 Abington Hall Place Unit 205
- 12160 Abington Hall Place
- 12160 Abington Hall Place Unit 208
- 12160 Abington Hall Place Unit 204
- 12160 Abington Hall Place Unit 102
- 12160 Abington Hall Place Unit 202
- 12161 Abington Hall Place Unit T2
- 12161 Abington Hall Place Unit T3
- 12161 Abington Hall Place Unit 201
- 12161 Abington Hall Place Unit 303
- 12161 Abington Hall Place Unit 304
- 12161 Abington Hall Place Unit 302