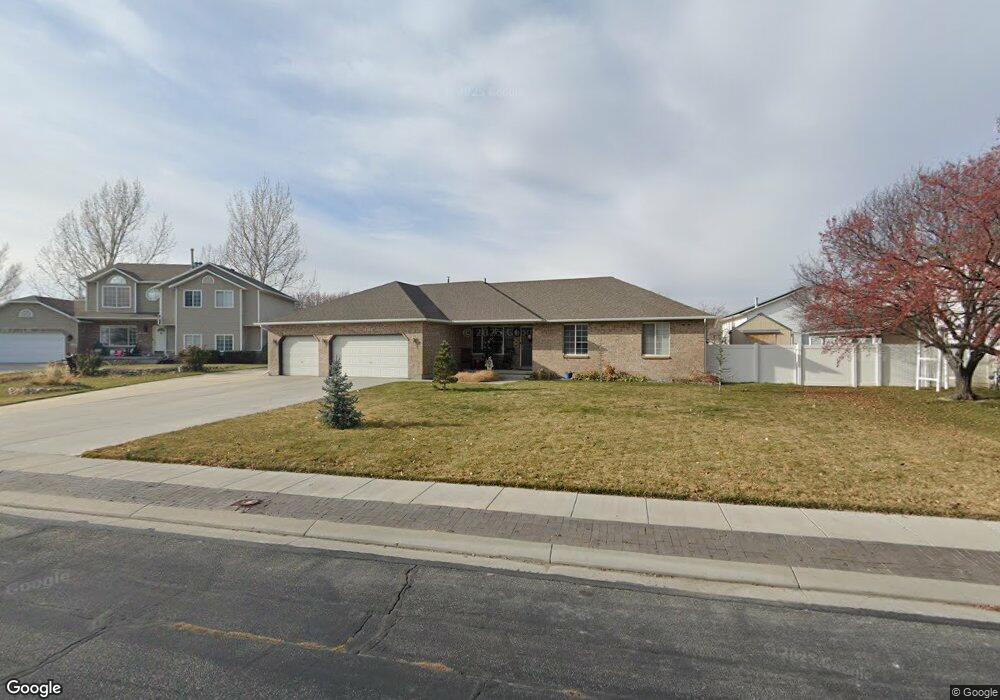
12162 S 3150 W Riverton, UT 84065
Estimated Value: $688,000 - $833,000
5
Beds
3
Baths
3,308
Sq Ft
$230/Sq Ft
Est. Value
About This Home
This home is located at 12162 S 3150 W, Riverton, UT 84065 and is currently estimated at $762,407, approximately $230 per square foot. 12162 S 3150 W is a home located in Salt Lake County with nearby schools including Rose Creek School, Oquirrh Hills Middle School, and Riverton High School.
Ownership History
Date
Name
Owned For
Owner Type
Purchase Details
Closed on
Oct 24, 2016
Sold by
Nciols Willam J
Bought by
Frandsen Chrsitperh and Frandsen Kerry
Current Estimated Value
Home Financials for this Owner
Home Financials are based on the most recent Mortgage that was taken out on this home.
Original Mortgage
$305,500
Outstanding Balance
$244,760
Interest Rate
3.44%
Mortgage Type
New Conventional
Estimated Equity
$517,647
Purchase Details
Closed on
Oct 8, 1996
Sold by
Nichols Lori L
Bought by
Nichols William J
Home Financials for this Owner
Home Financials are based on the most recent Mortgage that was taken out on this home.
Original Mortgage
$34,000
Interest Rate
8.1%
Purchase Details
Closed on
Sep 23, 1994
Sold by
Ron Thorne Construction Inc
Bought by
Nichols William J and Nichols Lori L
Home Financials for this Owner
Home Financials are based on the most recent Mortgage that was taken out on this home.
Original Mortgage
$127,600
Interest Rate
8.12%
Create a Home Valuation Report for This Property
The Home Valuation Report is an in-depth analysis detailing your home's value as well as a comparison with similar homes in the area
Home Values in the Area
Average Home Value in this Area
Purchase History
| Date | Buyer | Sale Price | Title Company |
|---|---|---|---|
| Frandsen Chrsitperh | -- | Integrated Title Ins Svcs | |
| Nichols William J | -- | -- | |
| Nichols William J | -- | -- |
Source: Public Records
Mortgage History
| Date | Status | Borrower | Loan Amount |
|---|---|---|---|
| Open | Frandsen Chrsitperh | $305,500 | |
| Previous Owner | Nichols William J | $34,000 | |
| Previous Owner | Nichols William J | $127,600 |
Source: Public Records
Tax History Compared to Growth
Tax History
| Year | Tax Paid | Tax Assessment Tax Assessment Total Assessment is a certain percentage of the fair market value that is determined by local assessors to be the total taxable value of land and additions on the property. | Land | Improvement |
|---|---|---|---|---|
| 2025 | $3,850 | $678,800 | $271,100 | $407,700 |
| 2024 | $3,850 | $666,300 | $246,100 | $420,200 |
| 2023 | $4,047 | $660,300 | $243,600 | $416,700 |
| 2022 | $4,080 | $653,100 | $238,800 | $414,300 |
| 2021 | $3,463 | $493,500 | $154,900 | $338,600 |
| 2020 | $3,364 | $447,000 | $154,900 | $292,100 |
| 2019 | $3,347 | $437,200 | $154,900 | $282,300 |
| 2018 | $3,109 | $399,900 | $144,600 | $255,300 |
| 2017 | $2,881 | $361,100 | $144,600 | $216,500 |
| 2016 | $2,599 | $312,600 | $144,600 | $168,000 |
| 2015 | $2,503 | $291,800 | $143,300 | $148,500 |
| 2014 | $2,407 | $275,100 | $136,400 | $138,700 |
Source: Public Records
Map
Nearby Homes
- 2853 W 12075 S
- 12191 S 3600 W
- 3168 Chalk Creek Way
- 12580 S Janice Dr
- 3644 W Harvest Gold Way
- 11881 S Harvest Gold Way
- 3636 W Harvest Gold Way
- 3622 W Harvest Gold Way
- 3376 W Water Crescent Place
- 3371 W Waterbridge Cove Unit 417
- 12501 Falls Creek Rd
- 11817 S 3700 W
- 11716 S 2610 W
- 12658 Old Fort Cir
- 2511 W 11730 S
- 2626 W Midas Side Way
- 2732 W Lizzi Cove
- 2602 W 11625 S
- 12906 Verona Creek Way
- 2356 W Montcalm Dr
- 12144 S 3150 W
- 12182 S 3150 W
- 12196 S 3150 W
- 12139 S 3150 W
- 12163 S 3235 W
- 12157 S 3150 W
- 12143 S 3235 W
- 12193 S 3150 W
- 12177 S 3150 W
- 3190 W 12130 S
- 3162 W 12130 S
- 12175 S 3235 W
- 3176 W Durham Woods Way
- 3176 Durham Woods Way
- 3154 W Durham Woods Way
- 3154 Durham Woods Way
- 3134 W 12130 S
- 3134 Durham Woods Way
- 3214 W 12130 S
- 3108 Durham Woods Way