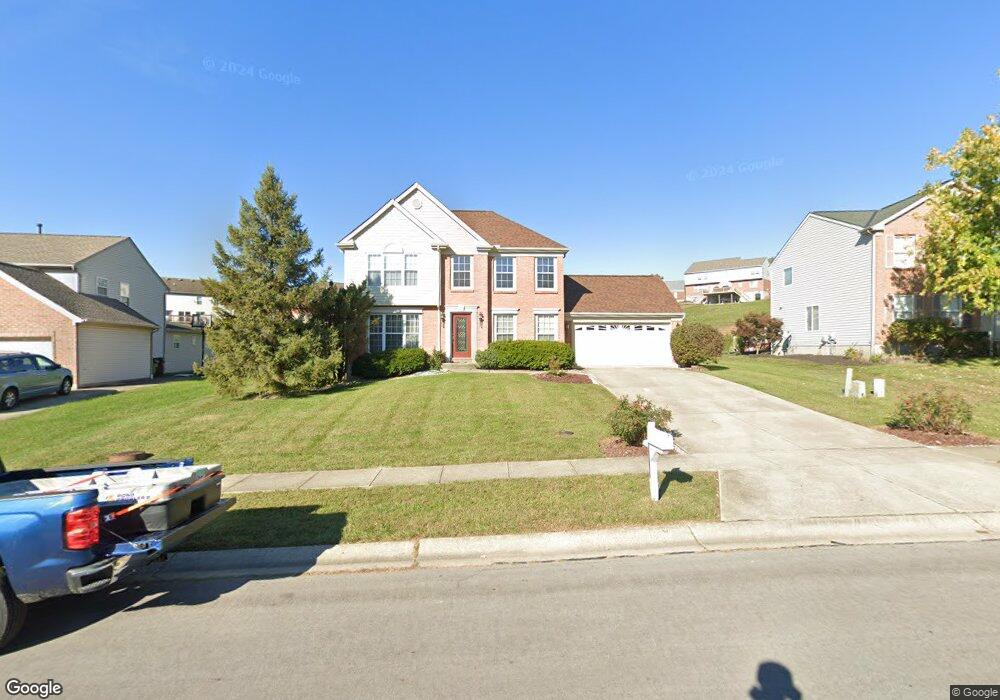
12165 Huntergreen Dr Cincinnati, OH 45251
Estimated Value: $319,768 - $402,000
3
Beds
3
Baths
1,668
Sq Ft
$207/Sq Ft
Est. Value
About This Home
This home is located at 12165 Huntergreen Dr, Cincinnati, OH 45251 and is currently estimated at $344,942, approximately $206 per square foot. 12165 Huntergreen Dr is a home located in Hamilton County with nearby schools including Pleasant Run Elementary School, Pleasant Run Middle School, and Northwest High School.
Ownership History
Date
Name
Owned For
Owner Type
Purchase Details
Closed on
Jan 24, 2014
Sold by
Carroll Dennis J and Carroll Tiffany
Bought by
Carroll Dennis J
Current Estimated Value
Home Financials for this Owner
Home Financials are based on the most recent Mortgage that was taken out on this home.
Original Mortgage
$163,860
Outstanding Balance
$122,359
Interest Rate
4.34%
Mortgage Type
New Conventional
Estimated Equity
$222,583
Purchase Details
Closed on
Nov 2, 2001
Sold by
Drees Company The
Bought by
Carroll Dennis J and Carroll Paula
Home Financials for this Owner
Home Financials are based on the most recent Mortgage that was taken out on this home.
Original Mortgage
$156,750
Interest Rate
5.87%
Mortgage Type
Unknown
Purchase Details
Closed on
Aug 1, 2000
Sold by
Hunterston Llc Ltd
Bought by
The Drees Company
Create a Home Valuation Report for This Property
The Home Valuation Report is an in-depth analysis detailing your home's value as well as a comparison with similar homes in the area
Home Values in the Area
Average Home Value in this Area
Purchase History
| Date | Buyer | Sale Price | Title Company |
|---|---|---|---|
| Carroll Dennis J | -- | Accommodation | |
| Carroll Dennis J | $165,000 | Prodigy Title Agency Inc | |
| The Drees Company | $135,000 | -- |
Source: Public Records
Mortgage History
| Date | Status | Borrower | Loan Amount |
|---|---|---|---|
| Open | Carroll Dennis J | $163,860 | |
| Closed | Carroll Dennis J | $156,750 |
Source: Public Records
Tax History
| Year | Tax Paid | Tax Assessment Tax Assessment Total Assessment is a certain percentage of the fair market value that is determined by local assessors to be the total taxable value of land and additions on the property. | Land | Improvement |
|---|---|---|---|---|
| 2025 | $5,301 | $90,279 | $12,425 | $77,854 |
| 2023 | $4,940 | $90,279 | $12,425 | $77,854 |
| 2022 | $3,445 | $50,918 | $9,555 | $41,363 |
| 2021 | $3,414 | $50,918 | $9,555 | $41,363 |
| 2020 | $3,447 | $50,918 | $9,555 | $41,363 |
| 2019 | $3,678 | $50,918 | $9,555 | $41,363 |
| 2018 | $3,307 | $50,918 | $9,555 | $41,363 |
| 2017 | $3,136 | $50,918 | $9,555 | $41,363 |
| 2016 | $3,177 | $50,978 | $10,658 | $40,320 |
| 2015 | $3,207 | $50,978 | $10,658 | $40,320 |
| 2014 | $3,213 | $50,978 | $10,658 | $40,320 |
| 2013 | $3,522 | $58,594 | $12,250 | $46,344 |
Source: Public Records
Map
Nearby Homes
- 12190 Kilbride Dr
- 12161 Birchgrove Ct
- 3330 Celedon Ct
- 6375 Jamesfield Ct
- 11992 Pippin Rd
- 11911 Pippin Rd
- 12158 Westerly Dr
- 6077 Gray Rd
- 2537 Haverknoll Dr
- 11835 Wincanton Dr
- 11995 Wincanton Dr
- 1301 Parkway Ct
- 1535 Gelhot Dr
- 1570 Gelhot Dr
- 1555 Gelhot Dr
- 12120 Regency Run Ct
- 12080 Regency Run Ct Unit 4
- 1594 Gelhot Dr
- 121 Elk Ct
- 1583 Hunter Rd
- 12157 Huntergreen Dr
- 12171 Huntergreen Dr
- 12149 Huntergreen Dr
- 12179 Huntergreen Dr
- 12160 Huntergreen Dr
- 12172 Huntergreen Dr
- 12152 Huntergreen Dr
- 3280 Wemyss Dr
- 12139 Huntergreen Dr
- 3276 Wemyss Dr
- 12185 Huntergreen Dr
- 12146 Huntergreen Dr
- 12180 Huntergreen Dr
- 3270 Wemyss Dr
- 3286 Wemyss Dr
- 12194 Kilbride Dr
- 12188 Huntergreen Dr
- 12134 Huntergreen Dr
- 12191 Huntergreen Dr
- 3266 Wemyss Dr
Your Personal Tour Guide
Ask me questions while you tour the home.