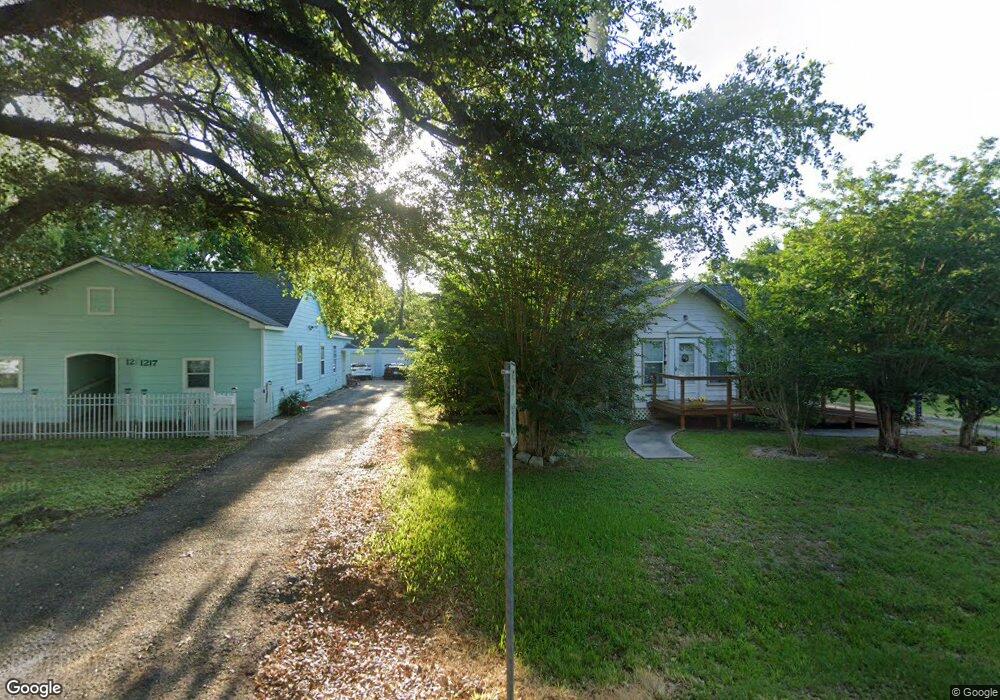
1217 8th St Rosenberg, TX 77471
Estimated Value: $179,000 - $225,000
3
Beds
2
Baths
1,524
Sq Ft
$135/Sq Ft
Est. Value
About This Home
This home is located at 1217 8th St, Rosenberg, TX 77471 and is currently estimated at $206,270, approximately $135 per square foot. 1217 8th St is a home located in Fort Bend County with nearby schools including Travis Elementary School, Navarro Middle School, and George Junior High School.
Ownership History
Date
Name
Owned For
Owner Type
Purchase Details
Closed on
Feb 3, 2006
Sold by
Rodriguez Pedro and Rodriguez Guadalupe
Bought by
Torres Francisco R and Torres Sofia M
Current Estimated Value
Purchase Details
Closed on
Dec 15, 2001
Sold by
Manrique Juan R and Manrique Luz R
Bought by
Manrique Luz R Life Estate
Purchase Details
Closed on
Jun 6, 2001
Sold by
Manrique Juan R and Manrique Luz R
Bought by
Manrique Lorenzo
Create a Home Valuation Report for This Property
The Home Valuation Report is an in-depth analysis detailing your home's value as well as a comparison with similar homes in the area
Home Values in the Area
Average Home Value in this Area
Purchase History
| Date | Buyer | Sale Price | Title Company |
|---|---|---|---|
| Torres Francisco R | -- | Startex Title Company | |
| Manrique Luz R Life Estate | -- | -- | |
| Manrique Lorenzo | -- | None Available | |
| Manrique Luz R Life Estate | -- | -- |
Source: Public Records
Tax History Compared to Growth
Tax History
| Year | Tax Paid | Tax Assessment Tax Assessment Total Assessment is a certain percentage of the fair market value that is determined by local assessors to be the total taxable value of land and additions on the property. | Land | Improvement |
|---|---|---|---|---|
| 2025 | $109 | $125,357 | $54,850 | $70,507 |
| 2024 | $109 | $135,278 | $38,641 | $96,637 |
| 2023 | $80 | $122,980 | $25,768 | $97,212 |
| 2022 | $51 | $111,800 | $23,670 | $88,130 |
| 2021 | $2,109 | $101,640 | $38,830 | $62,810 |
| 2020 | $1,961 | $92,400 | $38,290 | $54,110 |
| 2019 | $1,919 | $84,000 | $23,460 | $60,540 |
| 2018 | $1,871 | $80,590 | $23,460 | $57,130 |
| 2017 | $1,835 | $78,620 | $23,460 | $55,160 |
| 2016 | $1,687 | $72,270 | $23,460 | $48,810 |
| 2015 | $177 | $72,710 | $23,460 | $49,250 |
| 2014 | $178 | $71,270 | $23,460 | $47,810 |
Source: Public Records
Map
Nearby Homes