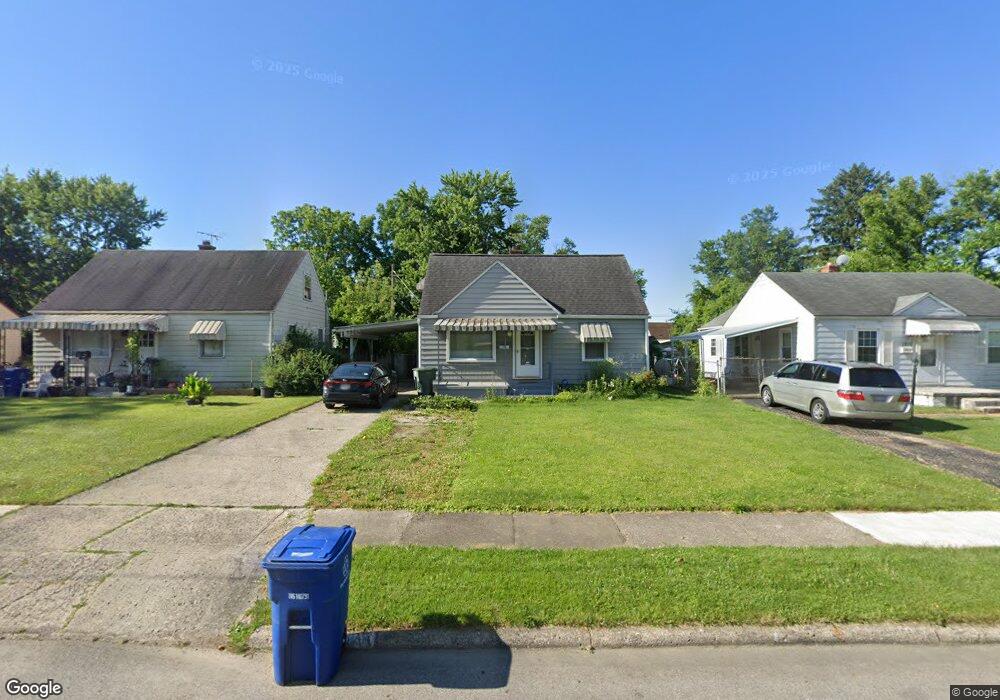
1217 Carolyn Ave Columbus, OH 43224
North Linden NeighborhoodEstimated Value: $197,000 - $224,000
3
Beds
1
Bath
979
Sq Ft
$211/Sq Ft
Est. Value
About This Home
This home is located at 1217 Carolyn Ave, Columbus, OH 43224 and is currently estimated at $206,654, approximately $211 per square foot. 1217 Carolyn Ave is a home located in Franklin County with nearby schools including Huy Elementary School, Medina Middle School, and Mifflin High School.
Ownership History
Date
Name
Owned For
Owner Type
Purchase Details
Closed on
Jul 12, 2023
Sold by
Mcduff Holdings Llp
Bought by
Jb Equity Llc
Current Estimated Value
Home Financials for this Owner
Home Financials are based on the most recent Mortgage that was taken out on this home.
Original Mortgage
$142,500
Outstanding Balance
$139,024
Interest Rate
6.67%
Mortgage Type
New Conventional
Estimated Equity
$67,630
Purchase Details
Closed on
Sep 25, 2018
Sold by
Farley Timothy L
Bought by
Mcduff Holdings Llp
Purchase Details
Closed on
Dec 27, 2010
Sold by
Risberg Marion J and Brubaker Kevin L
Bought by
Brubaker Kevin L
Purchase Details
Closed on
Nov 5, 2002
Sold by
Sheehan Tim J
Bought by
Farley Timothy L
Home Financials for this Owner
Home Financials are based on the most recent Mortgage that was taken out on this home.
Original Mortgage
$81,000
Interest Rate
7.76%
Mortgage Type
Purchase Money Mortgage
Purchase Details
Closed on
Jul 20, 1988
Bought by
Sheehan Tim J
Purchase Details
Closed on
Feb 17, 1988
Purchase Details
Closed on
Jul 1, 1984
Create a Home Valuation Report for This Property
The Home Valuation Report is an in-depth analysis detailing your home's value as well as a comparison with similar homes in the area
Home Values in the Area
Average Home Value in this Area
Purchase History
| Date | Buyer | Sale Price | Title Company |
|---|---|---|---|
| Jb Equity Llc | $190,000 | Omni Title | |
| Mcduff Holdings Llp | $102,000 | None Available | |
| Brubaker Kevin L | $43,200 | Northwest T | |
| Farley Timothy L | $81,000 | Chelsea Title Agency | |
| Sheehan Tim J | -- | -- | |
| -- | -- | -- | |
| -- | $35,000 | -- |
Source: Public Records
Mortgage History
| Date | Status | Borrower | Loan Amount |
|---|---|---|---|
| Open | Jb Equity Llc | $142,500 | |
| Previous Owner | Farley Timothy L | $81,000 |
Source: Public Records
Tax History Compared to Growth
Tax History
| Year | Tax Paid | Tax Assessment Tax Assessment Total Assessment is a certain percentage of the fair market value that is determined by local assessors to be the total taxable value of land and additions on the property. | Land | Improvement |
|---|---|---|---|---|
| 2024 | $2,854 | $62,270 | $14,910 | $47,360 |
| 2023 | $2,680 | $59,220 | $14,910 | $44,310 |
| 2022 | $1,992 | $37,490 | $7,210 | $30,280 |
| 2021 | $1,996 | $37,490 | $7,210 | $30,280 |
| 2020 | $1,999 | $37,490 | $7,210 | $30,280 |
| 2019 | $1,820 | $29,270 | $5,780 | $23,490 |
| 2018 | $1,664 | $29,270 | $5,780 | $23,490 |
| 2017 | $1,744 | $29,270 | $5,780 | $23,490 |
| 2016 | $1,714 | $25,870 | $5,500 | $20,370 |
| 2015 | $1,556 | $25,870 | $5,500 | $20,370 |
| 2014 | $1,559 | $25,870 | $5,500 | $20,370 |
| 2013 | $810 | $27,230 | $5,775 | $21,455 |
Source: Public Records
Map
Nearby Homes
- 1279 Carolyn Ave
- 1283 Pauline Ave
- 1258 Urana Ave
- 1270 Urana Ave
- 1126 Piedmont Rd
- 1120 Piedmont Rd
- 1090 Pauline Ave
- 3352 Karl Rd
- 3401 Walmar Dr
- 3268 McGuffey Rd
- 3519 Gerbert Rd
- 3480 Maize Rd
- 1303 Oakland Park Ave
- 3585 Gerbert Rd
- 1382 Elmore Ave
- 3129 McGuffey Rd
- 1507 Elmore Ave
- 876 Lenore Ave
- 886 Carolyn Ave
- 3107 Hamilton Ave
- 1211 Carolyn Ave
- 1223 Carolyn Ave
- 1205 Carolyn Ave
- 1229 Carolyn Ave
- 1235 Carolyn Ave
- 1199 Carolyn Ave
- 1208 Lenore Ave
- 1214 Lenore Ave
- 1202 Lenore Ave
- 1220 Lenore Ave
- 1196 Lenore Ave
- 1220 Carolyn Ave
- 1241 Carolyn Ave
- 1193 Carolyn Ave
- 1226 Carolyn Ave
- 1208 Carolyn Ave
- 1226 Lenore Ave
- 1232 Carolyn Ave
- 1190 Lenore Ave