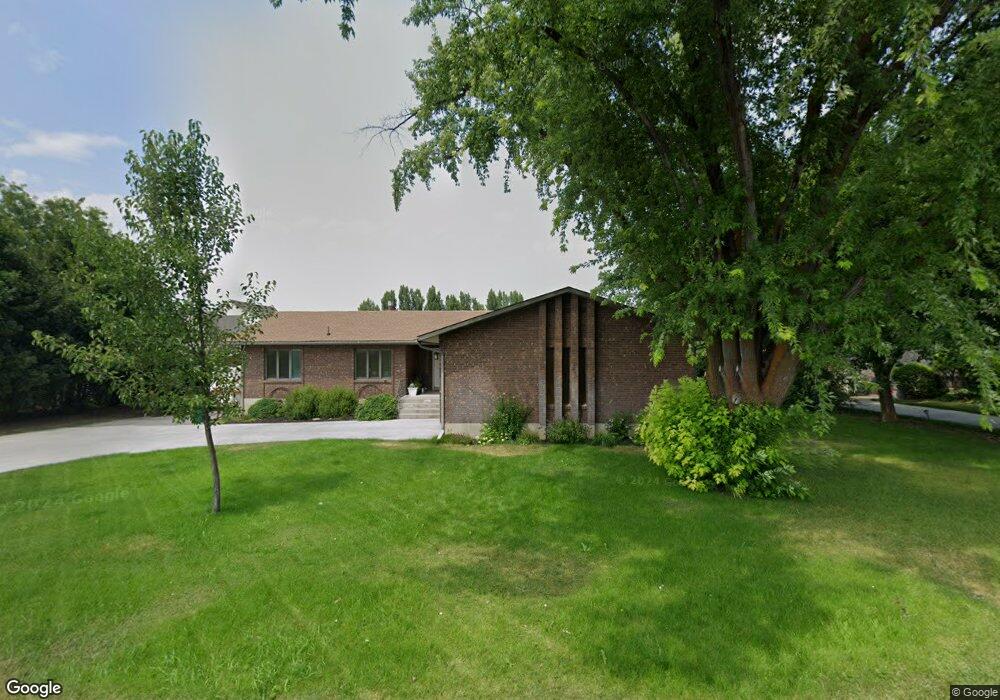
1217 E 2500 N North Logan, UT 84341
Estimated Value: $516,000 - $569,000
5
Beds
3
Baths
3,080
Sq Ft
$176/Sq Ft
Est. Value
About This Home
This home is located at 1217 E 2500 N, North Logan, UT 84341 and is currently estimated at $540,640, approximately $175 per square foot. 1217 E 2500 N is a home located in Cache County with nearby schools including North Park School, Cedar Ridge School, and North Cache Middle School.
Ownership History
Date
Name
Owned For
Owner Type
Purchase Details
Closed on
Jul 12, 2019
Sold by
Jcr Properties Llc
Bought by
Robinson Joel
Current Estimated Value
Home Financials for this Owner
Home Financials are based on the most recent Mortgage that was taken out on this home.
Original Mortgage
$245,000
Outstanding Balance
$214,537
Interest Rate
3.9%
Mortgage Type
Future Advance Clause Open End Mortgage
Estimated Equity
$326,103
Purchase Details
Closed on
Oct 13, 2017
Sold by
Robinson Brett D and Robinson Landree J
Bought by
Jcr Properties Llc
Purchase Details
Closed on
May 10, 2005
Sold by
Hildt Patricia
Bought by
Robinson Brett D and Robinson Landree J
Home Financials for this Owner
Home Financials are based on the most recent Mortgage that was taken out on this home.
Original Mortgage
$122,960
Interest Rate
6.02%
Mortgage Type
New Conventional
Create a Home Valuation Report for This Property
The Home Valuation Report is an in-depth analysis detailing your home's value as well as a comparison with similar homes in the area
Home Values in the Area
Average Home Value in this Area
Purchase History
| Date | Buyer | Sale Price | Title Company |
|---|---|---|---|
| Robinson Joel | -- | Pinnacle Title | |
| Jcr Properties Llc | -- | -- | |
| Robinson Brett D | -- | Hickman Land Title Company |
Source: Public Records
Mortgage History
| Date | Status | Borrower | Loan Amount |
|---|---|---|---|
| Open | Robinson Joel | $245,000 | |
| Previous Owner | Robinson Brett D | $122,960 |
Source: Public Records
Tax History
| Year | Tax Paid | Tax Assessment Tax Assessment Total Assessment is a certain percentage of the fair market value that is determined by local assessors to be the total taxable value of land and additions on the property. | Land | Improvement |
|---|---|---|---|---|
| 2025 | $1,938 | $271,260 | $0 | $0 |
| 2024 | $2,288 | $298,070 | $0 | $0 |
| 2023 | $2,091 | $254,840 | $0 | $0 |
| 2022 | $219 | $254,845 | $0 | $0 |
| 2021 | $2,081 | $375,760 | $83,800 | $291,960 |
| 2020 | $1,932 | $327,100 | $83,800 | $243,300 |
| 2019 | $1,877 | $303,449 | $83,800 | $219,649 |
| 2018 | $1,538 | $241,144 | $55,000 | $186,144 |
| 2017 | $1,474 | $121,660 | $0 | $0 |
| 2016 | $1,497 | $121,660 | $0 | $0 |
| 2015 | $1,503 | $121,660 | $0 | $0 |
| 2014 | $1,311 | $108,670 | $0 | $0 |
| 2013 | -- | $108,120 | $0 | $0 |
Source: Public Records
Map
Nearby Homes
- 1185 E 2500 N
- 1335 E 2300 N
- 1872 N 515 W
- 1495 E 2300 N
- 1593 N 110 W Unit 201
- 611 E 2450 N Unit 1
- 1593 N 110 W Unit 202
- 1593 N 110 W Unit 204
- 1200 W 1400 N
- 2950 N Mahogony Valley Rd E Unit 7
- 1598 N Sharptail Cir
- 1000 W 2500 N
- 2284 N 740 E
- 741 E 2200 N
- 2469 N 620 E Unit 3
- 2477 N 620 E Unit 4
- 2168 N 750 E
- 2025 N 1550 E
- 710 E 2160 N
- 105 E 3100 N
Your Personal Tour Guide
Ask me questions while you tour the home.