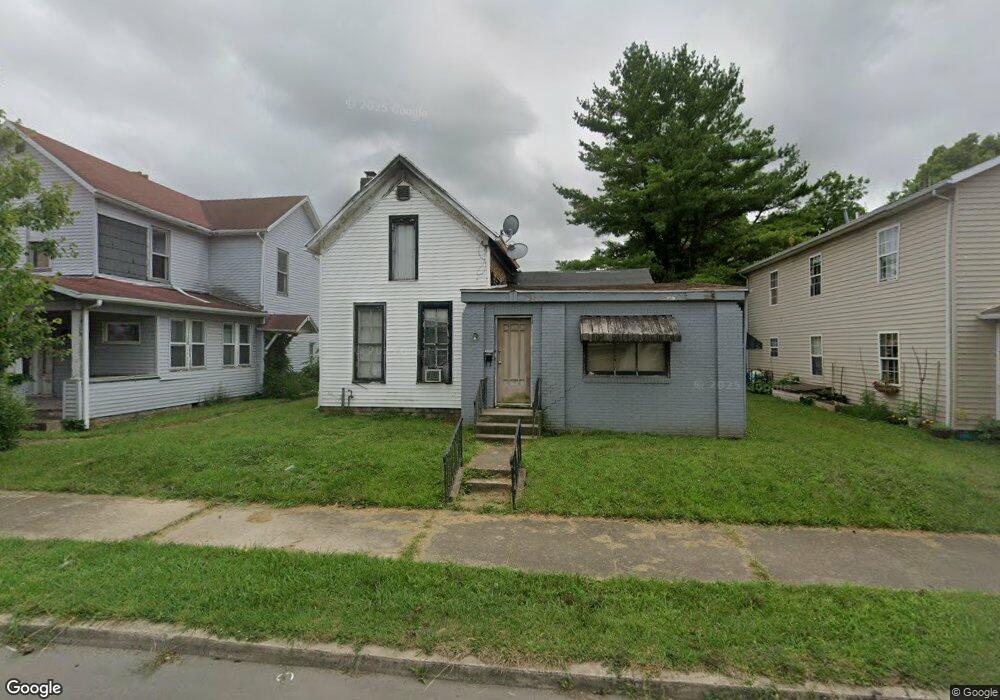
1217 E Main St Muncie, IN 47305
East Central NeighborhoodEstimated Value: $88,648 - $118,000
3
Beds
1
Bath
1,508
Sq Ft
$67/Sq Ft
Est. Value
About This Home
This home is located at 1217 E Main St, Muncie, IN 47305 and is currently estimated at $101,412, approximately $67 per square foot. 1217 E Main St is a home located in Delaware County with nearby schools including East Washington Academy, Muncie Central High School, and Northside Middle School.
Ownership History
Date
Name
Owned For
Owner Type
Purchase Details
Closed on
Jul 22, 2024
Sold by
Gonzales Juan
Bought by
Cheques Corner Llc
Current Estimated Value
Purchase Details
Closed on
May 12, 2017
Sold by
Llamas Maria L and Llamas Alejandro
Bought by
Gonzalesab Juan
Purchase Details
Closed on
Apr 30, 2010
Sold by
Llamas Maria L and Llamas Alejandro
Bought by
Llamas Maria L and Llamas Alejandro
Purchase Details
Closed on
Apr 24, 2008
Sold by
Wells Fargo Bank
Bought by
Llamas Maria L and Llamas Alejanro
Purchase Details
Closed on
Sep 26, 2007
Sold by
Goodman Steven N
Bought by
Wells Fargo Bank
Purchase Details
Closed on
Oct 19, 2005
Sold by
Baker Spencer D
Bought by
Goodman Steven N
Home Financials for this Owner
Home Financials are based on the most recent Mortgage that was taken out on this home.
Original Mortgage
$40,500
Interest Rate
8.37%
Mortgage Type
Adjustable Rate Mortgage/ARM
Purchase Details
Closed on
Jan 11, 2005
Sold by
Smalstig Tara M and Estate Of Dorothy E Joseph
Bought by
Baker Spencer D
Create a Home Valuation Report for This Property
The Home Valuation Report is an in-depth analysis detailing your home's value as well as a comparison with similar homes in the area
Home Values in the Area
Average Home Value in this Area
Purchase History
| Date | Buyer | Sale Price | Title Company |
|---|---|---|---|
| Cheques Corner Llc | -- | None Listed On Document | |
| Gonzalesab Juan | -- | None Available | |
| Llamas Maria L | -- | None Available | |
| Llamas Maria L | -- | None Available | |
| Wells Fargo Bank | -- | None Available | |
| Goodman Steven N | -- | None Available | |
| Baker Spencer D | -- | None Available |
Source: Public Records
Mortgage History
| Date | Status | Borrower | Loan Amount |
|---|---|---|---|
| Previous Owner | Goodman Steven N | $40,500 |
Source: Public Records
Tax History
| Year | Tax Paid | Tax Assessment Tax Assessment Total Assessment is a certain percentage of the fair market value that is determined by local assessors to be the total taxable value of land and additions on the property. | Land | Improvement |
|---|---|---|---|---|
| 2025 | $687 | $64,600 | $13,200 | $51,400 |
| 2024 | $687 | $54,600 | $13,200 | $41,400 |
| 2023 | $563 | $45,500 | $11,000 | $34,500 |
| 2022 | $553 | $44,500 | $15,900 | $28,600 |
| 2021 | $586 | $47,800 | $15,900 | $31,900 |
| 2020 | $506 | $39,800 | $13,300 | $26,500 |
| 2019 | $495 | $38,700 | $13,300 | $25,400 |
| 2018 | $524 | $36,200 | $12,100 | $24,100 |
| 2017 | $788 | $34,000 | $10,500 | $23,500 |
| 2016 | $766 | $32,900 | $10,500 | $22,400 |
| 2014 | $695 | $32,600 | $10,000 | $22,600 |
| 2013 | -- | $32,400 | $10,000 | $22,400 |
Source: Public Records
Map
Nearby Homes
- 1114 E Jackson St
- 1125 E Washington St
- 1319 E Jackson St
- 1335 E Washington St
- 1005 E Jackson St
- 1508 E Main St
- 633 S Ohio Ave
- 825 E Washington St
- 304 N Hackley St
- 1617 E Jackson St
- 1302 E Kirby Ave
- 1318 E Kirby Ave
- 1008 E Kirby Ave
- 1311 E Kirby Ave
- 409 N Pershing Dr
- 320 N Vine St
- 1402 E Willard St
- 1000 E Willard St
- 822 N Wolfe St
- 1222 E 5th St
- 1211 E Main St
- 1221 E Main St
- 1209 E Main St
- 1225 E Main St
- 1203 E Main St
- 1214 E Jackson St
- 1210 E Jackson St
- 109 S Ohio Ave
- 1218 E Main St
- 1224 E Main St
- 1200 E Jackson St
- 102 S Ohio Ave
- 1307 E Main St
- 1122 E Jackson St
- 113 N Ohio Ave
- 1311 E Main St
- 104 N Ohio Ave
- 1219 E Jackson St
- 117 N Ohio Ave
- 1209 E Jackson St
Your Personal Tour Guide
Ask me questions while you tour the home.