L
Seller's Agent in 2014
Lana Thies
IOWA REALTY
Estimated Value: $179,219 - $207,000
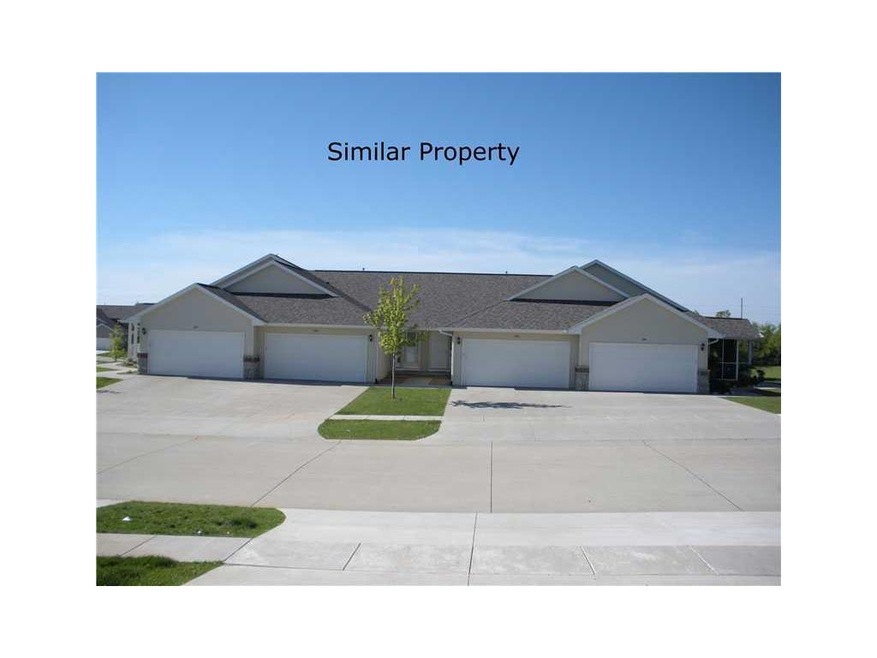
THIS SIDE BY SIDE VALENCIA PLAN IS LOCATED IN THE NEW CRESCENT VIEW DEVELOPMENT ON THE NORTHEAST SIDE. THIS UNIT HAS ALMOST 900 SQUARE FEET OF LIVING SPACE AND LIVES LARGE. THIS UNIT OFFER A VAULTED CEILING, EAT IN KITCHEN, A RAISED EATING BAR, A BATHROOM OFF THE MASTER BEDROOM AND A MAIN LEVEL LAUNDRY. THIS UNIT IS ENERGY STAR CERTIFIED. THE HOME BASE PRICE ALLOWS BUYERS TO CHOOSE FROM A VARIETY OF QUALITY FINISH OPTIONS, INCLUDING OVER 50 CARPET SELECTIONS AND OVER 40 VINYL SELECTIONS. CABINETS COME IN OVER 10 COLOR SELECTIONS IN 3 DOOR SYLES. LIGHTING AND DOOR HARDWARE ARE AVAILABLE IN 2 DIFFERENT FINISHES. THERE ARE MULTIPLE COUNTERTOP CHOICES AND THE APPLIANCES ARE AVAILABLE IN BLACK OR WHITE. THIS BUILDING HAS A PASSIVE RADON SYSTEM INSTALLED. A FLOOR PLAN FOR THIS UNIT IS ATTACHED. THERE IS A $120 ASSOCIATION START UP FEE.
Last Agent to Sell the Property
Lana Thies
IOWA REALTY Listed on: 04/25/2014
| Date | Buyer | Sale Price | Title Company |
|---|---|---|---|
| Digmann Colleen K | -- | -- |
| Date | Status | Borrower | Loan Amount |
|---|---|---|---|
| Open | Digmann Colleen K | $92,625 |
| Date | Event | Price | List to Sale | Price per Sq Ft |
|---|---|---|---|---|
| 09/24/2014 09/24/14 | Sold | $123,811 | +7.7% | $139 / Sq Ft |
| 05/22/2014 05/22/14 | Pending | -- | -- | -- |
| 04/25/2014 04/25/14 | For Sale | $115,000 | -- | $129 / Sq Ft |
| Year | Tax Paid | Tax Assessment Tax Assessment Total Assessment is a certain percentage of the fair market value that is determined by local assessors to be the total taxable value of land and additions on the property. | Land | Improvement |
|---|---|---|---|---|
| 2025 | $2,680 | $209,000 | $35,500 | $173,500 |
| 2024 | $3,198 | $161,800 | $35,500 | $126,300 |
| 2023 | $3,198 | $147,200 | $35,500 | $111,700 |
| 2022 | $2,984 | $148,800 | $30,000 | $118,800 |
| 2021 | $3,072 | $143,700 | $30,000 | $113,700 |
| 2020 | $3,072 | $139,400 | $26,000 | $113,400 |
| 2019 | $2,798 | $129,000 | $26,000 | $103,000 |
| 2018 | $2,676 | $129,000 | $26,000 | $103,000 |
| 2017 | $2,647 | $121,700 | $12,000 | $109,700 |
| 2016 | $2,647 | $121,700 | $12,000 | $109,700 |
| 2015 | -- | $0 | $0 | $0 |
L
Seller's Agent in 2014
Lana Thies
IOWA REALTY
Source: Cedar Rapids Area Association of REALTORS®
MLS Number: 1402728
APN: 11273-82002-01030
Disclaimer: Certain information contained herein is derived from information provided by parties other than Homes.com. All information provided is deemed reliable, but is not guaranteed to be accurate and should be independently verified.
![]() IDX information is provided exclusively for personal, non-commercial use, and may not be used for any purpose other than to identify prospective properties consumers may be interested in purchasing.
IDX information is provided exclusively for personal, non-commercial use, and may not be used for any purpose other than to identify prospective properties consumers may be interested in purchasing.
Information is deemed reliable but not guaranteed.
