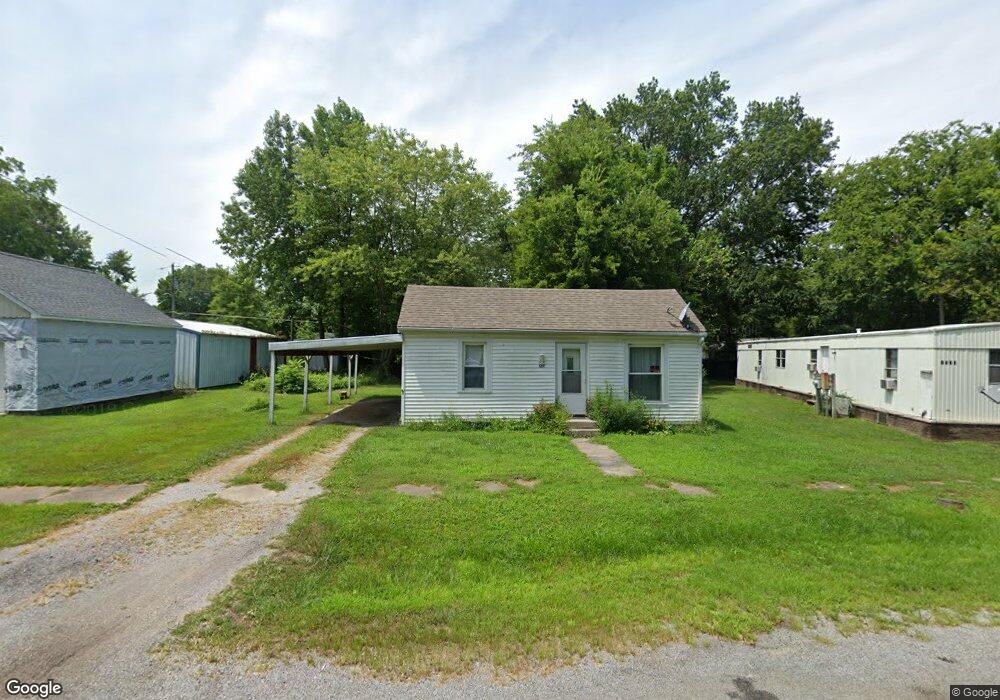
1217 N 9th St Herrin, IL 62948
Estimated Value: $53,680 - $127,000
Studio
--
Bath
700
Sq Ft
$128/Sq Ft
Est. Value
About This Home
This home is located at 1217 N 9th St, Herrin, IL 62948 and is currently estimated at $89,670, approximately $128 per square foot. 1217 N 9th St is a home located in Williamson County with nearby schools including North Side Primary Center, Herrin Community Elementary School, and Herrin Middle School.
Ownership History
Date
Name
Owned For
Owner Type
Purchase Details
Closed on
Aug 9, 2021
Sold by
Wade Larry B and Wade Gloria E
Bought by
Bhs Property Solutions Llc
Current Estimated Value
Home Financials for this Owner
Home Financials are based on the most recent Mortgage that was taken out on this home.
Original Mortgage
$80,300
Outstanding Balance
$51,386
Interest Rate
4.75%
Mortgage Type
New Conventional
Estimated Equity
$38,284
Purchase Details
Closed on
Sep 19, 2018
Sold by
Camden Danny N and Camden Sandra L
Bought by
Wade Larry B and Wade Gloria E
Create a Home Valuation Report for This Property
The Home Valuation Report is an in-depth analysis detailing your home's value as well as a comparison with similar homes in the area
Home Values in the Area
Average Home Value in this Area
Purchase History
| Date | Buyer | Sale Price | Title Company |
|---|---|---|---|
| Bhs Property Solutions Llc | $23,500 | Aden Shane | |
| Bhs Property Solutions Llc | $23,500 | Aden Shane | |
| Wade Larry B | -- | -- |
Source: Public Records
Mortgage History
| Date | Status | Borrower | Loan Amount |
|---|---|---|---|
| Open | Bhs Property Solutions Llc | $80,300 | |
| Closed | Bhs Property Solutions Llc | $80,300 |
Source: Public Records
Tax History
| Year | Tax Paid | Tax Assessment Tax Assessment Total Assessment is a certain percentage of the fair market value that is determined by local assessors to be the total taxable value of land and additions on the property. | Land | Improvement |
|---|---|---|---|---|
| 2025 | $1,355 | $15,580 | $2,920 | $12,660 |
| 2024 | $1,385 | $15,580 | $2,920 | $12,660 |
| 2023 | $1,355 | $15,580 | $2,920 | $12,660 |
| 2022 | $1,174 | $13,720 | $2,570 | $11,150 |
| 2021 | $1,142 | $13,230 | $2,480 | $10,750 |
| 2020 | $1,142 | $12,500 | $2,340 | $10,160 |
| 2019 | $1,062 | $12,500 | $2,340 | $10,160 |
| 2018 | $1,062 | $12,500 | $2,340 | $10,160 |
| 2017 | $1,038 | $12,500 | $2,340 | $10,160 |
| 2015 | $993 | $11,840 | $2,220 | $9,620 |
| 2013 | $772 | $11,840 | $2,220 | $9,620 |
| 2012 | $772 | $11,840 | $2,220 | $9,620 |
Source: Public Records
Map
Nearby Homes
Your Personal Tour Guide
Ask me questions while you tour the home.