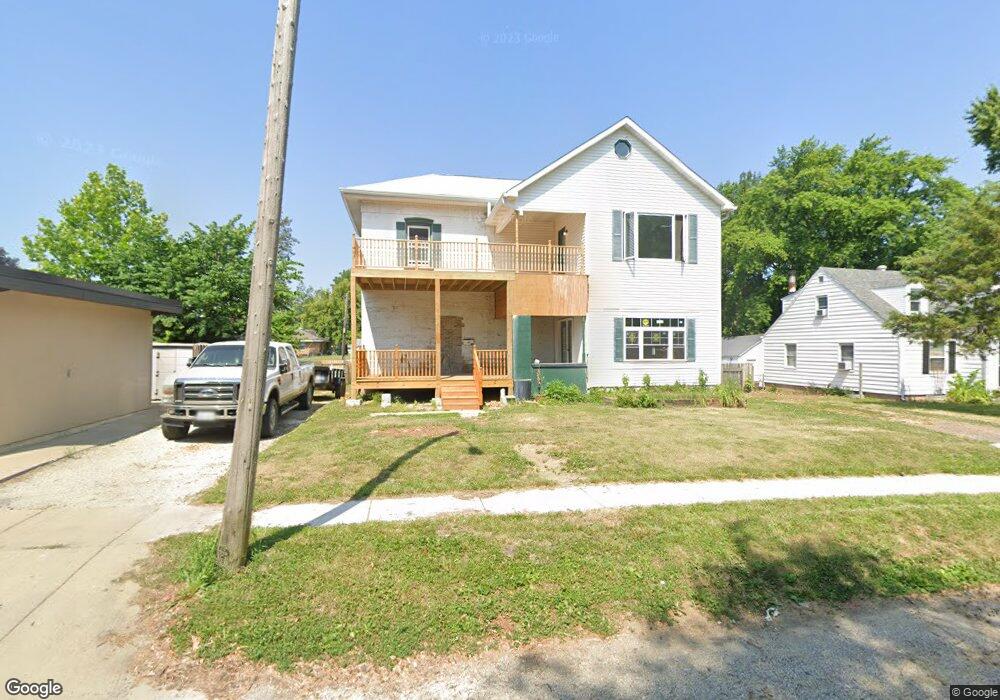
1217 N Osburn Ave Springfield, IL 62702
Oak Ridge NeighborhoodEstimated Value: $59,000 - $94,000
--
Bed
--
Bath
--
Sq Ft
6,752
Sq Ft Lot
About This Home
This home is located at 1217 N Osburn Ave, Springfield, IL 62702 and is currently estimated at $77,399. 1217 N Osburn Ave is a home located in Sangamon County with nearby schools including Enos Elementary School, U.S. Grant Middle School, and Lanphier High School.
Ownership History
Date
Name
Owned For
Owner Type
Purchase Details
Closed on
Nov 29, 2022
Sold by
Path Forward Real Estate Solutions Llc
Bought by
Cox Scott E
Current Estimated Value
Purchase Details
Closed on
Oct 13, 2022
Sold by
Justin Jewal Solutons Llc
Bought by
Path Forward Real Estate Solutions Llc
Purchase Details
Closed on
Aug 1, 2019
Sold by
Keith Groesch
Bought by
Justin Jewal Solutions Llc
Home Financials for this Owner
Home Financials are based on the most recent Mortgage that was taken out on this home.
Original Mortgage
$26,500
Interest Rate
1%
Mortgage Type
Construction
Purchase Details
Closed on
Jul 22, 2014
Purchase Details
Closed on
Oct 22, 2010
Purchase Details
Closed on
Aug 30, 2010
Purchase Details
Closed on
Apr 28, 2010
Purchase Details
Closed on
Jun 30, 2006
Purchase Details
Closed on
Jun 2, 2006
Purchase Details
Closed on
May 23, 2006
Purchase Details
Closed on
Jan 23, 2004
Purchase Details
Closed on
Dec 28, 1994
Purchase Details
Closed on
Nov 1, 1994
Create a Home Valuation Report for This Property
The Home Valuation Report is an in-depth analysis detailing your home's value as well as a comparison with similar homes in the area
Home Values in the Area
Average Home Value in this Area
Purchase History
| Date | Buyer | Sale Price | Title Company |
|---|---|---|---|
| Cox Scott E | $77,000 | -- | |
| Path Forward Real Estate Solutions Llc | -- | -- | |
| Justin Jewal Solutions Llc | $27,000 | Prairie Land Title | |
| -- | -- | -- | |
| -- | $40,000 | -- | |
| -- | -- | -- | |
| -- | -- | -- | |
| -- | $65,000 | -- | |
| -- | -- | -- | |
| -- | $54,700 | -- | |
| -- | -- | -- | |
| -- | $18,500 | -- | |
| -- | -- | -- |
Source: Public Records
Mortgage History
| Date | Status | Borrower | Loan Amount |
|---|---|---|---|
| Previous Owner | Justin Jewal Solutions Llc | $26,500 |
Source: Public Records
Tax History Compared to Growth
Tax History
| Year | Tax Paid | Tax Assessment Tax Assessment Total Assessment is a certain percentage of the fair market value that is determined by local assessors to be the total taxable value of land and additions on the property. | Land | Improvement |
|---|---|---|---|---|
| 2024 | $1,710 | $20,360 | $3,329 | $17,031 |
| 2023 | $3,029 | $34,257 | $3,041 | $31,216 |
| 2022 | $1,530 | $17,070 | $2,885 | $14,185 |
| 2021 | $1,479 | $16,431 | $2,777 | $13,654 |
| 2020 | $1,450 | $16,456 | $2,781 | $13,675 |
| 2019 | $2,470 | $28,471 | $2,772 | $25,699 |
| 2018 | $2,011 | $23,803 | $2,758 | $21,045 |
| 2017 | $1,970 | $23,495 | $2,722 | $20,773 |
| 2016 | $1,931 | $23,152 | $2,682 | $20,470 |
| 2015 | $1,912 | $22,875 | $2,650 | $20,225 |
| 2014 | $1,883 | $22,727 | $2,633 | $20,094 |
| 2013 | $1,841 | $22,727 | $2,633 | $20,094 |
Source: Public Records
Map
Nearby Homes
- 501 W North Grand Ave
- 420 W North Grand Ave
- 1142 N Virginia Ave
- 616 W Calhoun Ave
- 401 W Elliott Ave
- 519 W Herndon St
- 1515 N Lincoln Ave Unit 63
- 1515 N Lincoln Ave Unit 39
- 1515 N Lincoln Ave Unit 62
- 1515 N Lincoln Ave Unit 48
- 1042 N 1st St
- 524 W Carpenter St
- 411 W Carpenter St
- 54 Lilac Ln
- 1453 N 3rd St
- 1328 N 3rd St
- 11 Hedge Dr
- 1132 N 3rd St
- 420 W Reynolds St
- 342 W Reynolds St
- 1225 N Osburn Ave
- 1227 N Osburn Ave
- 815 W North Grand Ave
- 831 N Grand Ave W
- 827 N Grand Ave W
- 819 N Grand Ave W
- 815 N Grand Ave W
- 1231 N Osburn Ave
- 1200 N Osburn Ave
- 1216 N Patton St
- 735 N Grand Ave W
- 1206 N Osburn Ave
- 1237 N Osburn Ave
- 1218 N Patton Ave
- 1222 N Patton St
- 1208 N Osburn Ave
- 731 N Grand Ave W
- 1212 N Osburn Ave
- 1220 N Patton St
- 800 N Grand Ave W