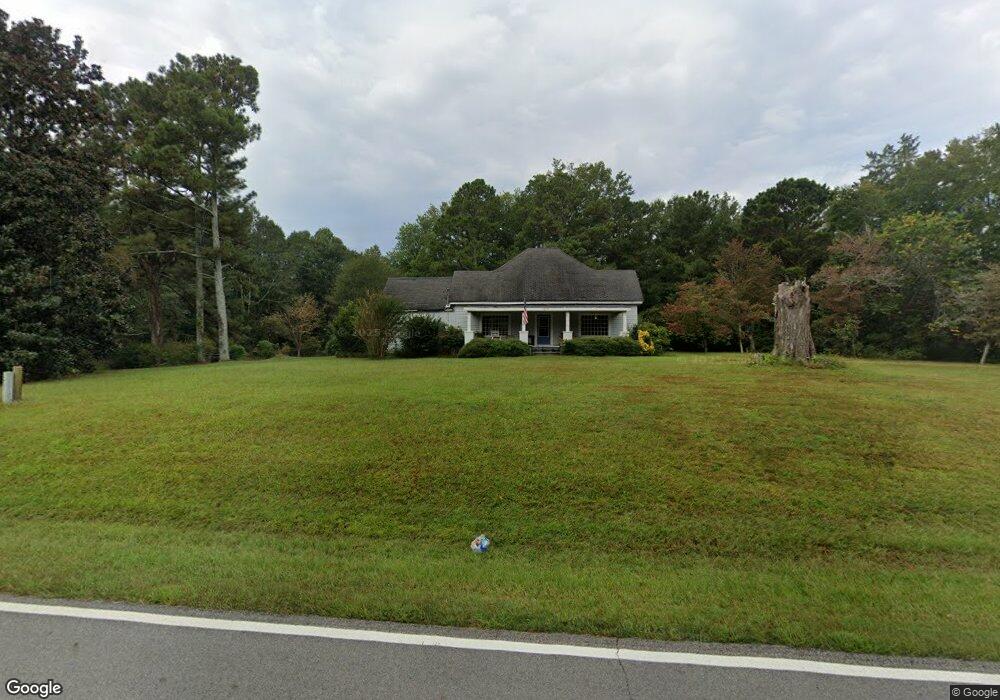
1217 Reavesville Rd Bowdon, GA 30108
Estimated Value: $226,314 - $334,000
2
Beds
1
Bath
1,968
Sq Ft
$152/Sq Ft
Est. Value
About This Home
This home is located at 1217 Reavesville Rd, Bowdon, GA 30108 and is currently estimated at $299,829, approximately $152 per square foot. 1217 Reavesville Rd is a home located in Carroll County with nearby schools including Bowdon Elementary School, Bowdon Middle School, and Bowdon High School.
Ownership History
Date
Name
Owned For
Owner Type
Purchase Details
Closed on
Sep 2, 2021
Sold by
Huggins Rebekah
Bought by
Rogers David Wesley and Rogers Norie Cescutti
Current Estimated Value
Home Financials for this Owner
Home Financials are based on the most recent Mortgage that was taken out on this home.
Original Mortgage
$106,700
Outstanding Balance
$96,944
Interest Rate
2.7%
Mortgage Type
New Conventional
Estimated Equity
$202,885
Purchase Details
Closed on
Nov 3, 2017
Sold by
Chambers Fay
Bought by
Huggins Rebekah
Home Financials for this Owner
Home Financials are based on the most recent Mortgage that was taken out on this home.
Original Mortgage
$69,937
Interest Rate
3.85%
Mortgage Type
New Conventional
Purchase Details
Closed on
Aug 4, 1998
Sold by
Chambers Hollis A and Chambers Fay W
Bought by
Chambers Fay W
Purchase Details
Closed on
Sep 27, 1991
Sold by
Chambers
Bought by
Chambers Hollis A and Jtrs Fay W
Purchase Details
Closed on
Sep 18, 1991
Bought by
Chambers
Create a Home Valuation Report for This Property
The Home Valuation Report is an in-depth analysis detailing your home's value as well as a comparison with similar homes in the area
Home Values in the Area
Average Home Value in this Area
Purchase History
| Date | Buyer | Sale Price | Title Company |
|---|---|---|---|
| Rogers David Wesley | $110,000 | -- | |
| Huggins Rebekah | $72,100 | -- | |
| Chambers Fay W | -- | -- | |
| Chambers Hollis A | -- | -- | |
| Chambers | -- | -- |
Source: Public Records
Mortgage History
| Date | Status | Borrower | Loan Amount |
|---|---|---|---|
| Open | Rogers David Wesley | $106,700 | |
| Previous Owner | Huggins Rebekah | $69,937 |
Source: Public Records
Tax History Compared to Growth
Tax History
| Year | Tax Paid | Tax Assessment Tax Assessment Total Assessment is a certain percentage of the fair market value that is determined by local assessors to be the total taxable value of land and additions on the property. | Land | Improvement |
|---|---|---|---|---|
| 2024 | $2,218 | $98,029 | $19,739 | $78,290 |
| 2023 | $2,218 | $88,736 | $15,792 | $72,944 |
| 2022 | $1,104 | $69,512 | $10,528 | $58,984 |
| 2021 | $1,569 | $61,196 | $8,422 | $52,774 |
| 2020 | $1,369 | $53,346 | $7,656 | $45,690 |
| 2019 | $1,002 | $38,706 | $7,656 | $31,050 |
| 2018 | $757 | $31,146 | $3,124 | $28,022 |
| 2017 | $96 | $31,185 | $3,163 | $28,022 |
| 2016 | $96 | $31,185 | $3,163 | $28,022 |
| 2015 | $95 | $19,318 | $5,189 | $14,129 |
| 2014 | $96 | $19,318 | $5,189 | $14,129 |
Source: Public Records
Map
Nearby Homes
- 992 Reavesville Rd
- 6 Winding Rd
- 5 Winding Rd
- 101 Winding Rd Unit LOT 6
- 101 Winding Rd Unit LOT 5
- 101 Winding Rd Unit LOT 1A & 1B & LOT 2
- 1794 Georgia 100
- 1770 Georgia 100
- 0 New Mexico Rd Unit TRACT 1 (7.47 ACRES)
- 0 New Mexico Road (Tract 1-- 7 47 Acres) Unit 234
- 75 Dashboard Rd
- 746 Dot Rd
- 162 Old Roanoke Rd
- 1195 Watts Rd
- 215 Wessmanor Dr
- 0 Old Columbus Rd Unit 24031335
- 0 Old Columbus Rd Unit 10554750
- 3129 Georgia 5
- 3101 Georgia 5
- 621 Rance Foster Rd
- 1234 Reavesville Rd
- 1197 Reavesville Rd
- 1285 Reavesville Rd
- 1137 Reavesville Rd
- 1318 Reavesville Rd
- 1288 Reavesville Rd
- 901 Wiley Wilson Rd
- 794 Wiley Wilson Rd
- 742 Wiley Wilson Rd
- 1335 Reavesville Rd
- 1100 Reavesville Rd
- 1100 Reasesville Rd
- 1380 Reavesville Rd
- 1276 Reavesville Rd
- 0 Reavesville Rd Unit 7354105
- 0 Reavesville Rd Unit 20175584
- 0 Reavesville Rd Unit 7479468
- 0 Reavesville Rd Unit 7469738
- 0 Reavesville Rd Unit 3283378
- 0 Reavesville Rd Unit 8563969