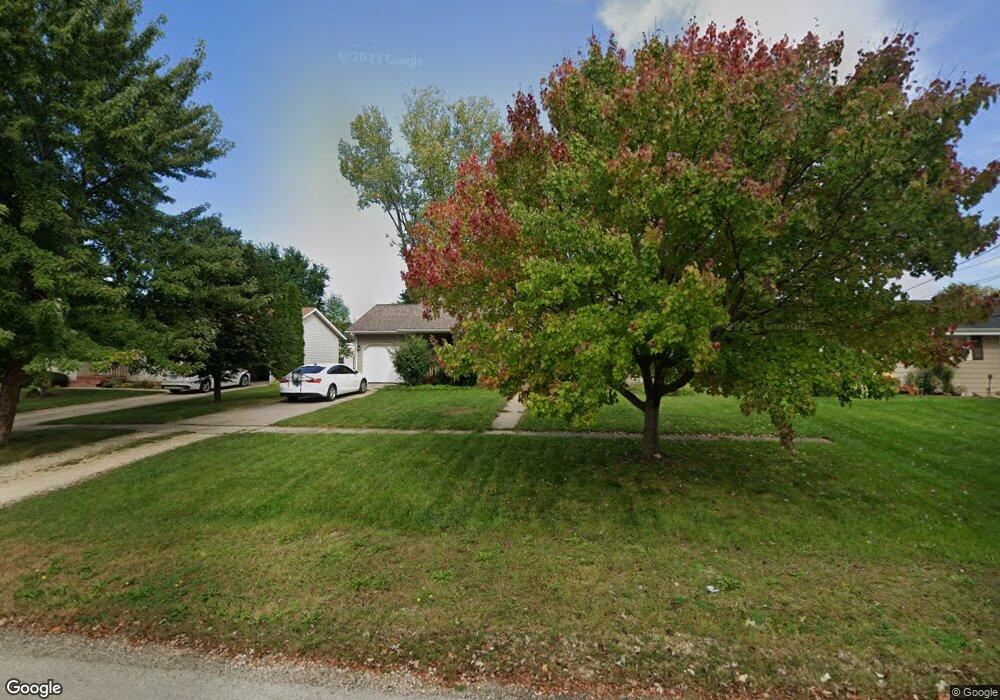
1217 W 4th St Belvidere, IL 61008
Estimated Value: $169,000 - $285,000
2
Beds
2
Baths
1,059
Sq Ft
$193/Sq Ft
Est. Value
About This Home
This home is located at 1217 W 4th St, Belvidere, IL 61008 and is currently estimated at $203,971, approximately $192 per square foot. 1217 W 4th St is a home located in Boone County with nearby schools including Washington Academy, Belvidere South Middle School, and Belvidere High School.
Ownership History
Date
Name
Owned For
Owner Type
Purchase Details
Closed on
Sep 7, 2018
Sold by
Benjamin Torres
Bought by
Rode Chad D
Current Estimated Value
Home Financials for this Owner
Home Financials are based on the most recent Mortgage that was taken out on this home.
Original Mortgage
$101,700
Outstanding Balance
$88,734
Interest Rate
4.62%
Mortgage Type
Construction
Estimated Equity
$115,237
Purchase Details
Closed on
Dec 2, 2005
Bought by
Torres Benjamin
Create a Home Valuation Report for This Property
The Home Valuation Report is an in-depth analysis detailing your home's value as well as a comparison with similar homes in the area
Home Values in the Area
Average Home Value in this Area
Purchase History
| Date | Buyer | Sale Price | Title Company |
|---|---|---|---|
| Rode Chad D | $169,500 | Attorney Only | |
| Torres Benjamin | $135,000 | -- |
Source: Public Records
Mortgage History
| Date | Status | Borrower | Loan Amount |
|---|---|---|---|
| Open | Rode Chad D | $101,700 |
Source: Public Records
Tax History Compared to Growth
Tax History
| Year | Tax Paid | Tax Assessment Tax Assessment Total Assessment is a certain percentage of the fair market value that is determined by local assessors to be the total taxable value of land and additions on the property. | Land | Improvement |
|---|---|---|---|---|
| 2024 | $3,963 | $51,852 | $3,844 | $48,008 |
| 2023 | $3,963 | $45,079 | $5,894 | $39,185 |
| 2022 | $3,433 | $41,446 | $5,894 | $35,552 |
| 2021 | $3,239 | $39,370 | $5,894 | $33,476 |
| 2020 | $3,019 | $35,278 | $6,214 | $29,064 |
| 2019 | $2,899 | $52,104 | $24,856 | $27,248 |
| 2018 | $3,608 | $130,732 | $104,263 | $26,469 |
| 2017 | $3,359 | $31,571 | $6,512 | $25,059 |
| 2016 | $3,359 | $30,280 | $6,406 | $23,874 |
| 2015 | $3,223 | $28,249 | $8,008 | $20,241 |
| 2014 | $2,434 | $28,743 | $8,008 | $20,735 |
Source: Public Records
Map
Nearby Homes