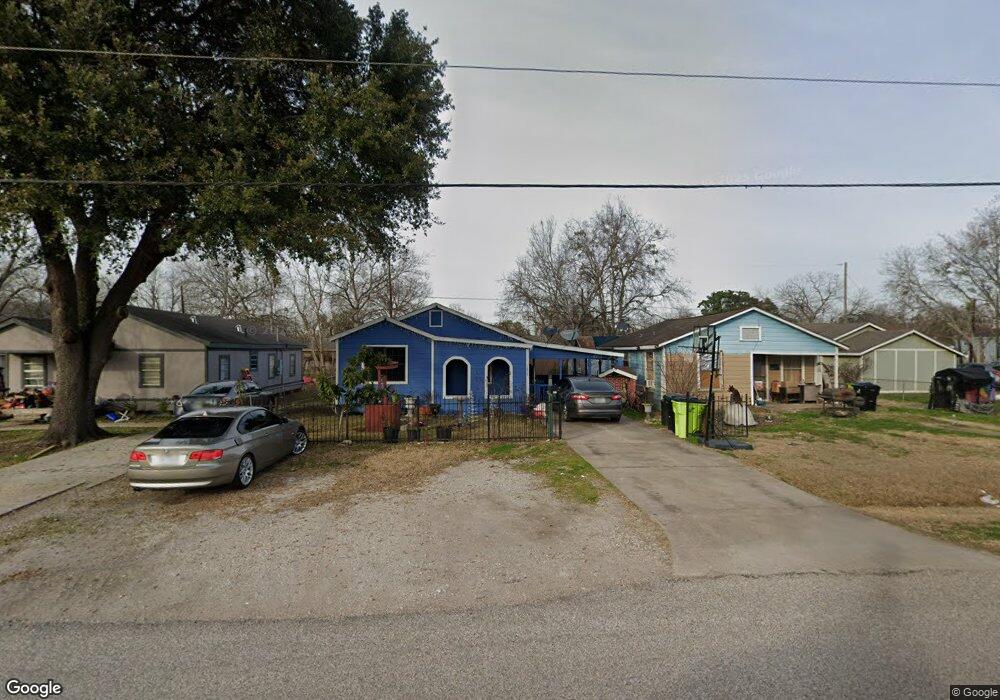
1217 Walnut Ave Rosenberg, TX 77471
Estimated Value: $125,000 - $143,000
1
Bed
1
Bath
912
Sq Ft
$144/Sq Ft
Est. Value
About This Home
This home is located at 1217 Walnut Ave, Rosenberg, TX 77471 and is currently estimated at $131,354, approximately $144 per square foot. 1217 Walnut Ave is a home located in Fort Bend County with nearby schools including Travis Elementary School, George Junior High School, and B.F. Terry High School.
Ownership History
Date
Name
Owned For
Owner Type
Purchase Details
Closed on
Jul 19, 2001
Sold by
Reyes Rito M
Bought by
Acevedo Juan Bolanos
Current Estimated Value
Purchase Details
Closed on
Dec 21, 1995
Sold by
Torres Alice and Torres Alicia
Bought by
Reyes Rito M
Home Financials for this Owner
Home Financials are based on the most recent Mortgage that was taken out on this home.
Original Mortgage
$16,000
Interest Rate
7.33%
Create a Home Valuation Report for This Property
The Home Valuation Report is an in-depth analysis detailing your home's value as well as a comparison with similar homes in the area
Home Values in the Area
Average Home Value in this Area
Purchase History
| Date | Buyer | Sale Price | Title Company |
|---|---|---|---|
| Acevedo Juan Bolanos | -- | First American Title | |
| Reyes Rito M | -- | American Title Company | |
| Acevedo Juan B | -- | -- |
Source: Public Records
Mortgage History
| Date | Status | Borrower | Loan Amount |
|---|---|---|---|
| Previous Owner | Reyes Rito M | $16,000 |
Source: Public Records
Tax History
| Year | Tax Paid | Tax Assessment Tax Assessment Total Assessment is a certain percentage of the fair market value that is determined by local assessors to be the total taxable value of land and additions on the property. | Land | Improvement |
|---|---|---|---|---|
| 2025 | $361 | $66,897 | $23,400 | $69,709 |
| 2024 | $361 | $60,815 | -- | $93,620 |
| 2023 | $346 | $55,286 | $0 | $94,136 |
| 2022 | $452 | $50,260 | $0 | $74,950 |
| 2021 | $948 | $45,690 | $13,860 | $31,830 |
| 2020 | $882 | $41,540 | $13,860 | $27,680 |
| 2019 | $862 | $37,760 | $13,860 | $23,900 |
| 2018 | $797 | $34,330 | $13,860 | $20,470 |
| 2017 | $787 | $33,720 | $13,860 | $19,860 |
| 2016 | $788 | $33,760 | $13,860 | $19,900 |
| 2015 | $397 | $34,140 | $13,860 | $20,280 |
| 2014 | $536 | $33,770 | $13,860 | $19,910 |
Source: Public Records
Map
Nearby Homes
Your Personal Tour Guide
Ask me questions while you tour the home.