Estimated Value: $261,000 - $287,000
3
Beds
2
Baths
1,390
Sq Ft
$197/Sq Ft
Est. Value
About This Home
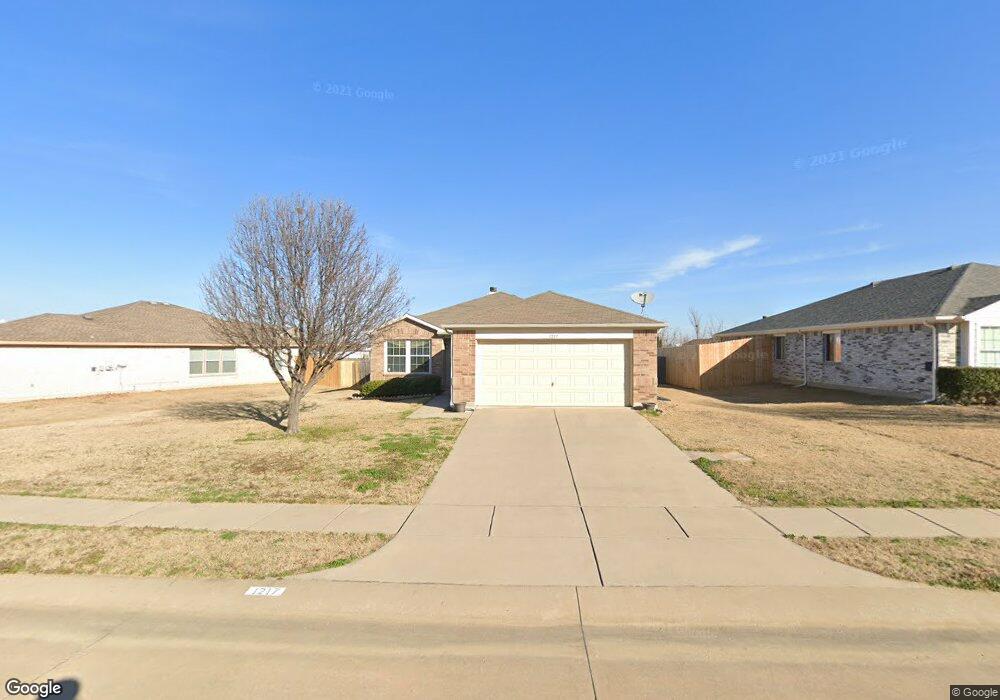
This home is located at 1217 Wenatchee Dr, Krum, TX 76249 and is currently estimated at $273,175, approximately $196 per square foot. 1217 Wenatchee Dr is a home located in Denton County with nearby schools including Krum Early Education Center, Blanche Dodd Intermediate School, and Krum Middle School.
Ownership History
Date
Name
Owned For
Owner Type
Purchase Details
Closed on
Mar 6, 2015
Sold by
American Homes 4 Rent Properties Eight L
Bought by
Amh 2015-1 Borrower Llc
Current Estimated Value
Home Financials for this Owner
Home Financials are based on the most recent Mortgage that was taken out on this home.
Original Mortgage
$552,830,000
Outstanding Balance
$423,412,181
Interest Rate
3.68%
Mortgage Type
Purchase Money Mortgage
Estimated Equity
-$423,139,006
Purchase Details
Closed on
Apr 15, 2014
Sold by
Sublett Gary
Bought by
American Homes 4 Rent Properties Eight L
Purchase Details
Closed on
Apr 30, 2007
Sold by
Rh Of Texas Lp
Bought by
Sublett Gary
Home Financials for this Owner
Home Financials are based on the most recent Mortgage that was taken out on this home.
Original Mortgage
$124,520
Interest Rate
6.16%
Mortgage Type
VA
Create a Home Valuation Report for This Property
The Home Valuation Report is an in-depth analysis detailing your home's value as well as a comparison with similar homes in the area
Home Values in the Area
Average Home Value in this Area
Purchase History
| Date | Buyer | Sale Price | Title Company |
|---|---|---|---|
| Amh 2015-1 Borrower Llc | -- | None Available | |
| American Homes 4 Rent Properties Eight L | $107,500 | None Available | |
| Sublett Gary | -- | Rtc |
Source: Public Records
Mortgage History
| Date | Status | Borrower | Loan Amount |
|---|---|---|---|
| Open | Amh 2015-1 Borrower Llc | $552,830,000 | |
| Previous Owner | Sublett Gary | $124,520 |
Source: Public Records
Tax History
| Year | Tax Paid | Tax Assessment Tax Assessment Total Assessment is a certain percentage of the fair market value that is determined by local assessors to be the total taxable value of land and additions on the property. | Land | Improvement |
|---|---|---|---|---|
| 2025 | $5,844 | $267,000 | $70,020 | $196,980 |
| 2024 | $5,844 | $290,000 | $70,020 | $219,980 |
| 2023 | $6,204 | $307,258 | $70,020 | $237,238 |
| 2022 | $5,553 | $242,075 | $70,020 | $172,055 |
| 2021 | $4,369 | $197,000 | $50,570 | $146,430 |
| 2020 | $4,144 | $183,000 | $42,012 | $140,988 |
| 2019 | $4,344 | $180,000 | $42,012 | $137,988 |
| 2018 | $4,002 | $165,000 | $42,012 | $122,988 |
| 2017 | $3,629 | $149,000 | $42,012 | $106,988 |
| 2016 | $2,619 | $107,500 | $25,674 | $81,826 |
| 2015 | $2,644 | $107,500 | $25,674 | $81,826 |
| 2014 | $2,644 | $107,500 | $25,674 | $81,826 |
| 2013 | -- | $119,414 | $25,674 | $93,740 |
Source: Public Records
Map
Nearby Homes
- 205 Comanche Trail
- 0 Farm To Market Road 1173
- tbdd Farm To Market Road 1173
- 3207 Camden Creek Rd
- 1606 Withers Way
- 3425 Eloise Ln
- 328 Saddlebrook Dr
- 334 Saddlebrook Dr
- 105 Thoroughbred Dr
- 101 Thoroughbred Dr
- 108 Thoroughbred Dr
- 107 N 7th St
- 101 N 7th St
- TBD Hopkins Rd
- 1627 Kawati Way
- 7272 Christina Ct
- 7257 Christina Ct
- TBD Masch Branch Rd
- 3725 Ranchers Ridge
- 3724 Ranchers Ridge
- 1219 Wenatchee Dr
- 1215 Wenatchee Dr
- 1220 Dakota Trail
- 1221 Wenatchee Dr
- 1222 Dakota Trail
- 1218 Wenatchee Dr
- 1220 Wenatchee Dr
- 1216 Wenatchee Dr
- 1223 Wenatchee Dr
- 1222 Wenatchee Dr
- 1224 Dakota Trail
- 1214 Wenatchee Dr
- 1224 Wenatchee Dr
- 207 Broken Arrow
- 203 Broken Arrow
- 1225 Wenatchee Dr
- 1226 Dakota Trail
- 209 Broken Arrow
- 1217 Aztec Trail
- 1219 Aztec Trail
Your Personal Tour Guide
Ask me questions while you tour the home.