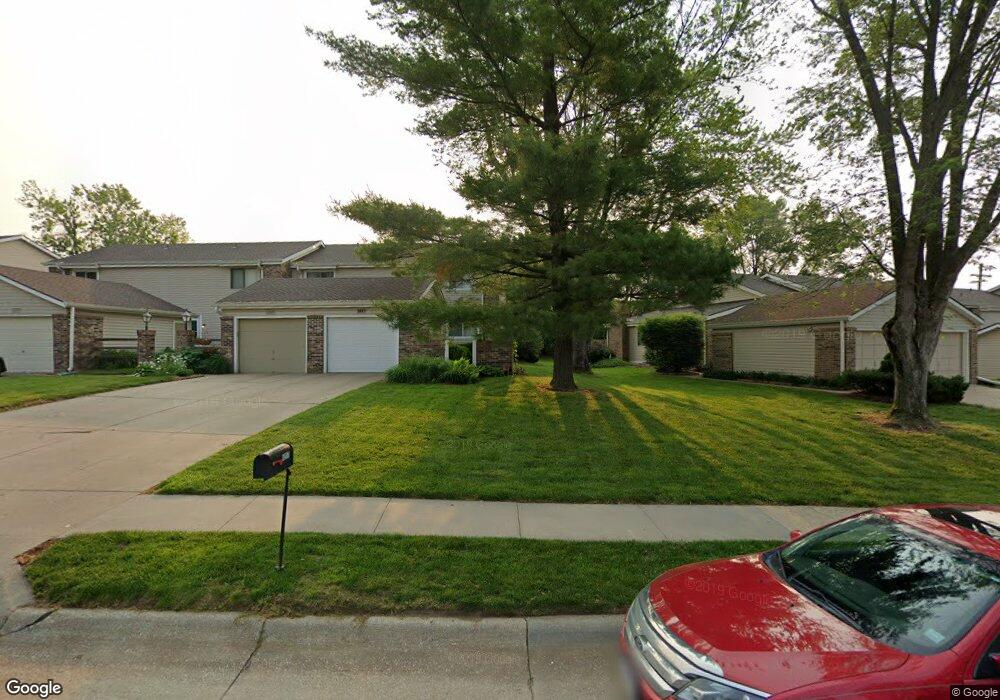
1217 Willow Ave Unit 7 Bellevue, NE 68005
Estimated Value: $167,000 - $198,000
3
Beds
2
Baths
1,304
Sq Ft
$140/Sq Ft
Est. Value
About This Home
This home is located at 1217 Willow Ave Unit 7, Bellevue, NE 68005 and is currently estimated at $182,294, approximately $139 per square foot. 1217 Willow Ave Unit 7 is a home located in Sarpy County with nearby schools including Twin Ridge Elementary School, Logan Fontenelle Middle School, and Bellevue West High School.
Ownership History
Date
Name
Owned For
Owner Type
Purchase Details
Closed on
Feb 2, 2009
Sold by
Metro 1St Mtg Llc
Bought by
Moore Eleanor Ann
Current Estimated Value
Home Financials for this Owner
Home Financials are based on the most recent Mortgage that was taken out on this home.
Original Mortgage
$50,000
Outstanding Balance
$31,300
Interest Rate
4.92%
Mortgage Type
Seller Take Back
Estimated Equity
$150,994
Purchase Details
Closed on
Aug 27, 2008
Sold by
Brooks Tamara Renee
Bought by
Metro 1St Mtg Llc
Purchase Details
Closed on
Mar 7, 2002
Sold by
Schneider Arthur J and Estate Of Kenneth B Schneider
Bought by
Brooks Tamara Renee
Home Financials for this Owner
Home Financials are based on the most recent Mortgage that was taken out on this home.
Original Mortgage
$71,250
Interest Rate
6.83%
Purchase Details
Closed on
Jan 9, 2001
Sold by
Eaton Arma H
Bought by
Schneider Kenneth B
Create a Home Valuation Report for This Property
The Home Valuation Report is an in-depth analysis detailing your home's value as well as a comparison with similar homes in the area
Home Values in the Area
Average Home Value in this Area
Purchase History
| Date | Buyer | Sale Price | Title Company |
|---|---|---|---|
| Moore Eleanor Ann | $80,000 | None Available | |
| Metro 1St Mtg Llc | $106,332 | None Available | |
| Brooks Tamara Renee | $75,000 | -- | |
| Schneider Kenneth B | $79,000 | -- |
Source: Public Records
Mortgage History
| Date | Status | Borrower | Loan Amount |
|---|---|---|---|
| Open | Moore Eleanor Ann | $50,000 | |
| Previous Owner | Brooks Tamara Renee | $71,250 |
Source: Public Records
Tax History Compared to Growth
Tax History
| Year | Tax Paid | Tax Assessment Tax Assessment Total Assessment is a certain percentage of the fair market value that is determined by local assessors to be the total taxable value of land and additions on the property. | Land | Improvement |
|---|---|---|---|---|
| 2025 | $2,509 | $156,879 | $15,000 | $141,879 |
| 2024 | $2,861 | $144,346 | $15,000 | $129,346 |
| 2023 | $2,861 | $135,507 | $15,000 | $120,507 |
| 2022 | $2,589 | $120,317 | $10,000 | $110,317 |
| 2021 | $2,575 | $118,369 | $10,000 | $108,369 |
| 2020 | $2,452 | $112,384 | $10,000 | $102,384 |
| 2019 | $2,408 | $111,060 | $10,000 | $101,060 |
| 2018 | $352 | $99,763 | $10,000 | $89,763 |
| 2017 | $2,038 | $95,862 | $10,000 | $85,862 |
| 2016 | $1,978 | $95,070 | $10,000 | $85,070 |
| 2015 | $1,893 | $91,526 | $10,000 | $81,526 |
| 2014 | $1,917 | $92,084 | $10,000 | $82,084 |
| 2012 | -- | $94,441 | $10,000 | $84,441 |
Source: Public Records
Map
Nearby Homes
- 1213 Willow Ave
- 2813 Bryan Ave
- 2303 Lloyd St
- 2804 Greensboro Ave
- 2308 Julie Cir
- 2203 Lloyd St
- 2113 Twinridge Dr
- 2303 Greensboro Ave
- 1409 Thomas Dr
- 2212 Greensboro Ave
- 2208 Greensboro Ave
- 2108 Randall Dr
- 11004 S 18th St
- 1206 Skyview Dr
- 1307 Terry Dr
- 10106 S 13th St
- 10014 S 14th St
- 129 Cedar Cir
- 1406 Sunshine Blvd
- 9912 S 9th Ave
- 1215 Willow Ave
- 1219 Willow Ave
- 1211 Willow Ave
- 1221 Willow Ave
- 1223 Willow Ave Unit 4
- 1209 Willow Ave Unit 11
- 1225 Willow Ave
- 1207 Willow Ave
- 1227 Willow Ave
- 1205 Willow Ave Unit 13
- 1229 Willow Ave Unit 1
- 1203 Willow Ave Unit 14
- 1201 Willow Ave Unit 15
- 1208 Willow Ave
- 1210 Willow Ave
- 1206 Willow Ave
- 1212 Willow Ave
- 1121 Willow Ave Unit 16
- 1204 Willow Ave
- 1119 Willow Ave Unit 17