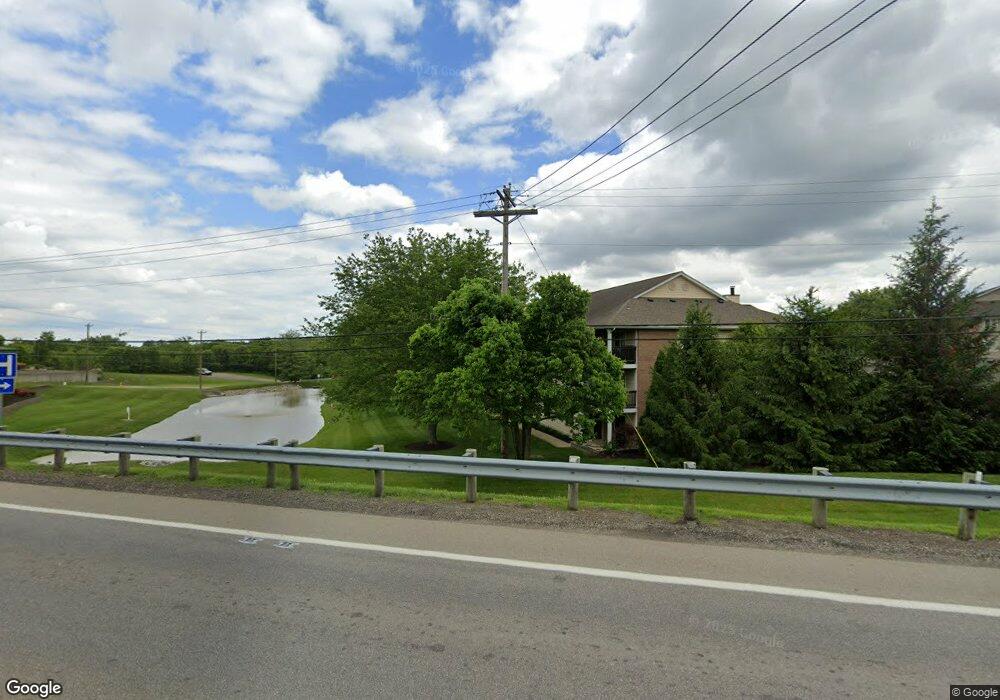
12171 Regency Run Ct Unit 2 Cincinnati, OH 45240
Pleasant Run Farms NeighborhoodEstimated Value: $154,000 - $185,000
2
Beds
2
Baths
1,146
Sq Ft
$149/Sq Ft
Est. Value
About This Home
This home is located at 12171 Regency Run Ct Unit 2, Cincinnati, OH 45240 and is currently estimated at $171,040, approximately $149 per square foot. 12171 Regency Run Ct Unit 2 is a home located in Hamilton County with nearby schools including Pleasant Run Elementary School, Pleasant Run Middle School, and Northwest High School.
Ownership History
Date
Name
Owned For
Owner Type
Purchase Details
Closed on
Mar 19, 2024
Sold by
Johnston Gerald
Bought by
Brown Coreen
Current Estimated Value
Purchase Details
Closed on
May 18, 2018
Sold by
Johnston Deborah
Bought by
Johnston Gerald
Purchase Details
Closed on
Feb 11, 2010
Sold by
Union Savings Bank
Bought by
Johnston Deborah
Purchase Details
Closed on
Jun 20, 2009
Sold by
Cerimele John
Bought by
Union Savings Bank
Purchase Details
Closed on
Jun 15, 2006
Sold by
Wardlow Oakley
Bought by
Hollenkamp Raymond L
Home Financials for this Owner
Home Financials are based on the most recent Mortgage that was taken out on this home.
Original Mortgage
$78,800
Interest Rate
6.73%
Mortgage Type
Purchase Money Mortgage
Purchase Details
Closed on
Mar 30, 1996
Sold by
Hal Homes Ltd 3
Bought by
Wardlow Paul J and Wardlow Oakley
Create a Home Valuation Report for This Property
The Home Valuation Report is an in-depth analysis detailing your home's value as well as a comparison with similar homes in the area
Home Values in the Area
Average Home Value in this Area
Purchase History
| Date | Buyer | Sale Price | Title Company |
|---|---|---|---|
| Brown Coreen | $173,400 | None Listed On Document | |
| Brown Coreen | $173,400 | None Listed On Document | |
| Johnston Gerald | $67,050 | None Available | |
| Johnston Deborah | $68,000 | Attorney | |
| Union Savings Bank | -- | Attorney | |
| Hollenkamp Raymond L | $98,500 | Old Town Title Agency | |
| Wardlow Paul J | $77,900 | -- |
Source: Public Records
Mortgage History
| Date | Status | Borrower | Loan Amount |
|---|---|---|---|
| Previous Owner | Hollenkamp Raymond L | $78,800 |
Source: Public Records
Tax History
| Year | Tax Paid | Tax Assessment Tax Assessment Total Assessment is a certain percentage of the fair market value that is determined by local assessors to be the total taxable value of land and additions on the property. | Land | Improvement |
|---|---|---|---|---|
| 2025 | $2,468 | $39,617 | $5,425 | $34,192 |
| 2024 | $1,802 | $39,617 | $5,425 | $34,192 |
| 2023 | $1,755 | $39,617 | $5,425 | $34,192 |
| 2022 | $1,178 | $25,120 | $5,075 | $20,045 |
| 2021 | $1,157 | $25,120 | $5,075 | $20,045 |
| 2020 | $1,183 | $25,120 | $5,075 | $20,045 |
| 2019 | $1,121 | $23,468 | $5,075 | $18,393 |
| 2018 | $1,014 | $23,468 | $5,075 | $18,393 |
| 2017 | $957 | $23,468 | $5,075 | $18,393 |
| 2016 | $688 | $19,278 | $3,948 | $15,330 |
| 2015 | $703 | $19,278 | $3,948 | $15,330 |
| 2014 | $705 | $19,278 | $3,948 | $15,330 |
| 2013 | $1,566 | $23,800 | $4,872 | $18,928 |
Source: Public Records
Map
Nearby Homes
- 12120 Regency Run Ct
- 12080 Regency Run Ct Unit 4
- 12158 Westerly Dr
- 11995 Wincanton Dr
- 2537 Haverknoll Dr
- 1535 Gelhot Dr
- 1959 John Gray Rd
- 1555 Gelhot Dr
- 1570 Gelhot Dr
- 6375 Jamesfield Ct
- 1594 Gelhot Dr
- 2163 Broadhurst Ave
- 1 Pinehurst Ct
- 1610 Gelhot Dr
- 121 Elk Ct
- 12161 Birchgrove Ct
- 11992 Pippin Rd
- 2150 Augusta Blvd
- 1583 Hunter Rd
- 11835 Wincanton Dr
- 12171 Regency Run Ct
- 12171 Regency Run Ct Unit 3
- 12171 Regency Run Ct Unit 6
- 12171 Regency Run Ct Unit 1
- 12171 Regency Run Ct Unit 10
- 12171 Regency Run Ct
- 12171 Regency Run Ct
- 12171 Regency Run Ct
- 12171 Regency Run Ct
- 12171 Regency Run Ct Unit 7
- 12171 Regency Run Ct Unit 12
- 12171 Regency Run Ct Unit 2171-2
- 12171 Regency Run Ct Unit 9
- 12171 Regency Run Ct Unit 11
- 12171 Regency Run Ct Unit 4
- 12171 Regency Run Ct Unit COURT
- 12171 Regency Run Ct Unit 8
- 12171 Regency Run Ct Unit 5
- 12191 Regency Run Ct Unit 3
- 12181 Regency Run Ct Unit 7
Your Personal Tour Guide
Ask me questions while you tour the home.