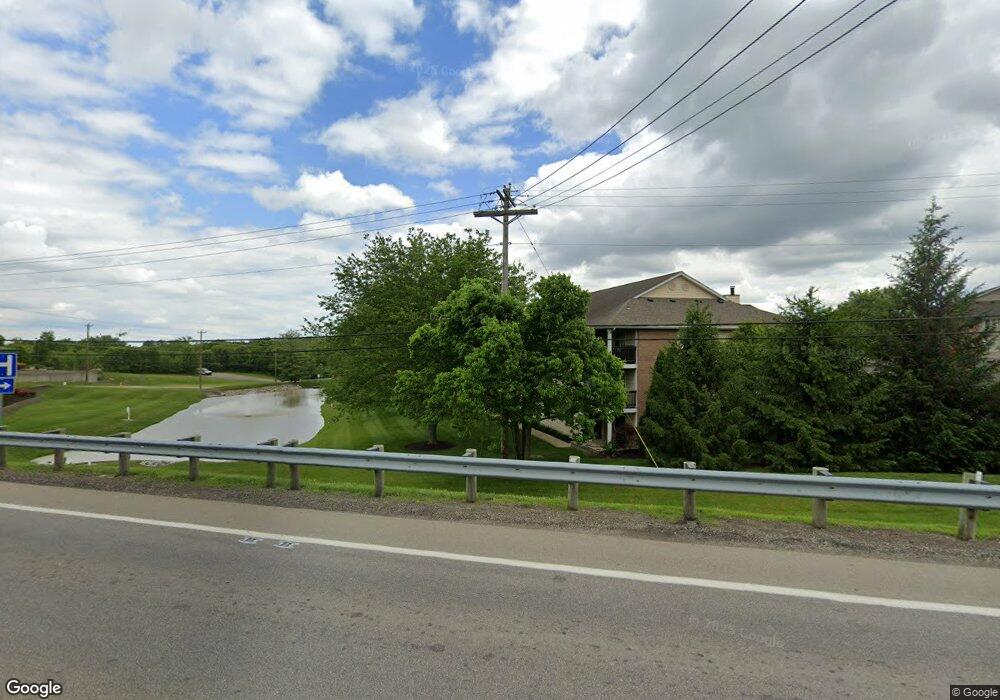
12171 Regency Run Ct Unit 9 Cincinnati, OH 45240
Pleasant Run Farms NeighborhoodEstimated Value: $162,000 - $217,000
2
Beds
2
Baths
1,140
Sq Ft
$160/Sq Ft
Est. Value
About This Home
This home is located at 12171 Regency Run Ct Unit 9, Cincinnati, OH 45240 and is currently estimated at $182,163, approximately $159 per square foot. 12171 Regency Run Ct Unit 9 is a home located in Hamilton County with nearby schools including Pleasant Run Elementary School, Pleasant Run Middle School, and Northwest High School.
Ownership History
Date
Name
Owned For
Owner Type
Purchase Details
Closed on
Mar 6, 2024
Sold by
Moksin Holdings Plus Llc
Bought by
Vesoljlis Loucas
Current Estimated Value
Home Financials for this Owner
Home Financials are based on the most recent Mortgage that was taken out on this home.
Original Mortgage
$169,750
Outstanding Balance
$166,932
Interest Rate
6.64%
Mortgage Type
New Conventional
Estimated Equity
$15,231
Purchase Details
Closed on
Aug 21, 2023
Sold by
Mcguffey Charmaine
Bought by
Moksin Holdings Plus Llc
Purchase Details
Closed on
Nov 15, 2002
Sold by
Brooks Paul V and Brooks Denise M
Bought by
Logan Patricia L
Home Financials for this Owner
Home Financials are based on the most recent Mortgage that was taken out on this home.
Original Mortgage
$57,900
Interest Rate
6.23%
Purchase Details
Closed on
Jun 12, 1998
Sold by
Hal Homes Ltd 3
Bought by
Brooks Paul and Brooks Denise M
Home Financials for this Owner
Home Financials are based on the most recent Mortgage that was taken out on this home.
Original Mortgage
$61,500
Interest Rate
7.32%
Create a Home Valuation Report for This Property
The Home Valuation Report is an in-depth analysis detailing your home's value as well as a comparison with similar homes in the area
Home Values in the Area
Average Home Value in this Area
Purchase History
| Date | Buyer | Sale Price | Title Company |
|---|---|---|---|
| Vesoljlis Loucas | $175,000 | 360 American Title | |
| Moksin Holdings Plus Llc | $115,100 | None Listed On Document | |
| Logan Patricia L | $58,000 | -- | |
| Brooks Paul | $76,900 | -- |
Source: Public Records
Mortgage History
| Date | Status | Borrower | Loan Amount |
|---|---|---|---|
| Open | Vesoljlis Loucas | $169,750 | |
| Previous Owner | Logan Patricia L | $57,900 | |
| Previous Owner | Brooks Paul | $61,500 |
Source: Public Records
Tax History Compared to Growth
Tax History
| Year | Tax Paid | Tax Assessment Tax Assessment Total Assessment is a certain percentage of the fair market value that is determined by local assessors to be the total taxable value of land and additions on the property. | Land | Improvement |
|---|---|---|---|---|
| 2024 | $2,441 | $38,245 | $5,425 | $32,820 |
| 2023 | $2,360 | $38,245 | $5,425 | $32,820 |
| 2022 | $1,842 | $24,815 | $5,075 | $19,740 |
| 2021 | $1,858 | $24,815 | $5,075 | $19,740 |
| 2020 | $1,161 | $24,815 | $5,075 | $19,740 |
| 2019 | $1,118 | $23,422 | $5,075 | $18,347 |
| 2018 | $1,011 | $23,422 | $5,075 | $18,347 |
| 2017 | $954 | $23,422 | $5,075 | $18,347 |
| 2016 | $846 | $21,662 | $4,113 | $17,549 |
| 2015 | $863 | $21,662 | $4,113 | $17,549 |
| 2014 | $865 | $21,662 | $4,113 | $17,549 |
| 2013 | $1,177 | $26,740 | $5,075 | $21,665 |
Source: Public Records
Map
Nearby Homes
- 12181 Regency Run Ct
- 12120 Regency Run Ct
- 12080 Regency Run Ct Unit 4
- 27 Carousel Cir
- 1777 Doral Dr
- 12057 Brookway Dr
- 46 Carousel Cir
- 12052 Doe Run Ct
- 2531 Retford Dr
- 11995 Wincanton Dr
- 2545 Haverknoll Dr
- 1605 W Augusta Blvd
- 1535 Gelhot Dr
- 1555 Gelhot Dr
- 12066 Spalding Dr
- 2617 Haverknoll Dr
- 2188 Broadhurst Ave
- 1570 Gelhot Dr
- 6367 Jamesfield Ct
- 1630 Gelhot Dr
- 12171 Regency Run Ct
- 12171 Regency Run Ct Unit 2
- 12171 Regency Run Ct Unit 3
- 12171 Regency Run Ct Unit 1
- 12171 Regency Run Ct Unit 10
- 12171 Regency Run Ct
- 12171 Regency Run Ct
- 12171 Regency Run Ct
- 12171 Regency Run Ct
- 12171 Regency Run Ct Unit 7
- 12171 Regency Run Ct Unit 12
- 12171 Regency Run Ct Unit 2171-2
- 12171 Regency Run Ct Unit 11
- 12171 Regency Run Ct Unit 4
- 12171 Regency Run Ct Unit COURT
- 12171 Regency Run Ct Unit 8
- 12171 Regency Run Ct Unit 5
- 12191 Regency Run Ct Unit 3
- 12181 Regency Run Ct Unit 7
- 12191 Regency Run Ct Unit 6