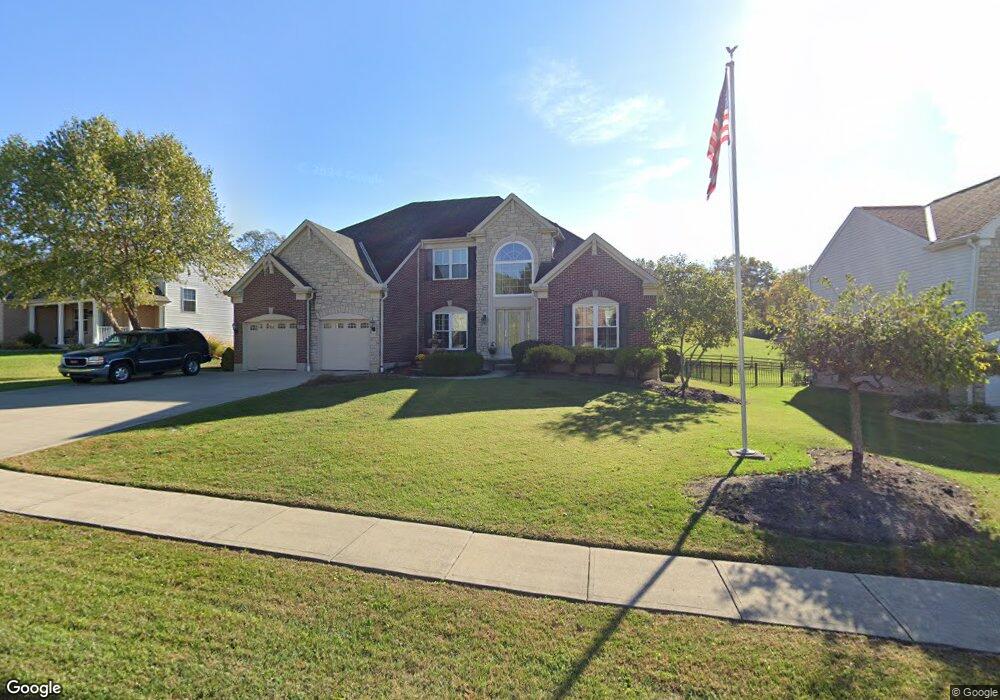
12172 Huntergreen Dr Cincinnati, OH 45251
Estimated Value: $437,000 - $457,922
4
Beds
4
Baths
2,844
Sq Ft
$158/Sq Ft
Est. Value
About This Home
This home is located at 12172 Huntergreen Dr, Cincinnati, OH 45251 and is currently estimated at $447,981, approximately $157 per square foot. 12172 Huntergreen Dr is a home located in Hamilton County with nearby schools including Pleasant Run Elementary School, Pleasant Run Middle School, and Northwest High School.
Ownership History
Date
Name
Owned For
Owner Type
Purchase Details
Closed on
Sep 27, 2018
Sold by
Knox Bruce H and Knox Carolyn Jean
Bought by
Beck Dale D and Notte Gail M
Current Estimated Value
Home Financials for this Owner
Home Financials are based on the most recent Mortgage that was taken out on this home.
Original Mortgage
$160,000
Outstanding Balance
$55,045
Interest Rate
3.29%
Mortgage Type
Adjustable Rate Mortgage/ARM
Estimated Equity
$392,936
Purchase Details
Closed on
Oct 18, 2001
Sold by
Drees Company The
Bought by
Knox H Bruce and Knox Carolyn Jean
Home Financials for this Owner
Home Financials are based on the most recent Mortgage that was taken out on this home.
Original Mortgage
$225,000
Interest Rate
6.72%
Purchase Details
Closed on
Apr 3, 2000
Sold by
Hunterston Llc Ltd
Bought by
The Drees Company
Purchase Details
Closed on
Dec 29, 1994
Sold by
Traditions Investments I Inc
Bought by
Engler Homes Inc
Create a Home Valuation Report for This Property
The Home Valuation Report is an in-depth analysis detailing your home's value as well as a comparison with similar homes in the area
Home Values in the Area
Average Home Value in this Area
Purchase History
| Date | Buyer | Sale Price | Title Company |
|---|---|---|---|
| Beck Dale D | $295,000 | Stewart Title Company | |
| Knox H Bruce | $329,100 | -- | |
| The Drees Company | $270,000 | -- | |
| Engler Homes Inc | -- | -- |
Source: Public Records
Mortgage History
| Date | Status | Borrower | Loan Amount |
|---|---|---|---|
| Open | Beck Dale D | $160,000 | |
| Previous Owner | Knox H Bruce | $225,000 |
Source: Public Records
Tax History Compared to Growth
Tax History
| Year | Tax Paid | Tax Assessment Tax Assessment Total Assessment is a certain percentage of the fair market value that is determined by local assessors to be the total taxable value of land and additions on the property. | Land | Improvement |
|---|---|---|---|---|
| 2024 | $7,583 | $140,000 | $12,425 | $127,575 |
| 2023 | $7,619 | $140,000 | $12,425 | $127,575 |
| 2022 | $6,895 | $103,250 | $9,555 | $93,695 |
| 2021 | $6,254 | $103,250 | $9,555 | $93,695 |
| 2020 | $6,324 | $103,250 | $9,555 | $93,695 |
| 2019 | $6,757 | $103,250 | $9,555 | $93,695 |
| 2018 | $6,173 | $104,906 | $9,555 | $95,351 |
| 2017 | $5,848 | $104,906 | $9,555 | $95,351 |
| 2016 | $6,236 | $110,219 | $10,658 | $99,561 |
| 2015 | $6,301 | $110,219 | $10,658 | $99,561 |
| 2014 | $6,312 | $110,219 | $10,658 | $99,561 |
| 2013 | $6,989 | $126,690 | $12,250 | $114,440 |
Source: Public Records
Map
Nearby Homes
- 3169 John Gray Rd
- 12190 Kilbride Dr
- 2892 Spruceway Dr
- 11916 Abbeytown Dr
- 11955 Merrion Ct
- 125 Blair House Place
- 6367 Jamesfield Ct
- 11992 Pippin Rd
- 2681 Haverknoll Dr
- 2605 Retford Dr
- 2617 Haverknoll Dr
- 2545 Haverknoll Dr
- 12058 Wincanton Dr
- 1481 Becker Dr
- 1605 W Augusta Blvd
- 11888 Kittrun Ct
- 27 Carousel Cir
- 1523 Hunter Rd
- 1515 Gelhot Dr
- 1535 Gelhot Dr
- 12180 Huntergreen Dr
- 12160 Huntergreen Dr
- 12188 Huntergreen Dr
- 12165 Huntergreen Dr
- 12146 Huntergreen Dr
- 12179 Huntergreen Dr
- 12194 Huntergreen Dr
- 12171 Huntergreen Dr
- 12185 Huntergreen Dr
- 12128 Huntergreen Dr
- 12157 Huntergreen Dr
- 12191 Huntergreen Dr
- 12149 Huntergreen Dr
- 12134 Huntergreen Dr
- 12139 Huntergreen Dr
- 12126 Huntergreen Dr
- 12200 Huntergreen Dr
- 12195 Huntergreen Dr
- 3165 John Gray Rd
- 12201 Huntergreen Dr