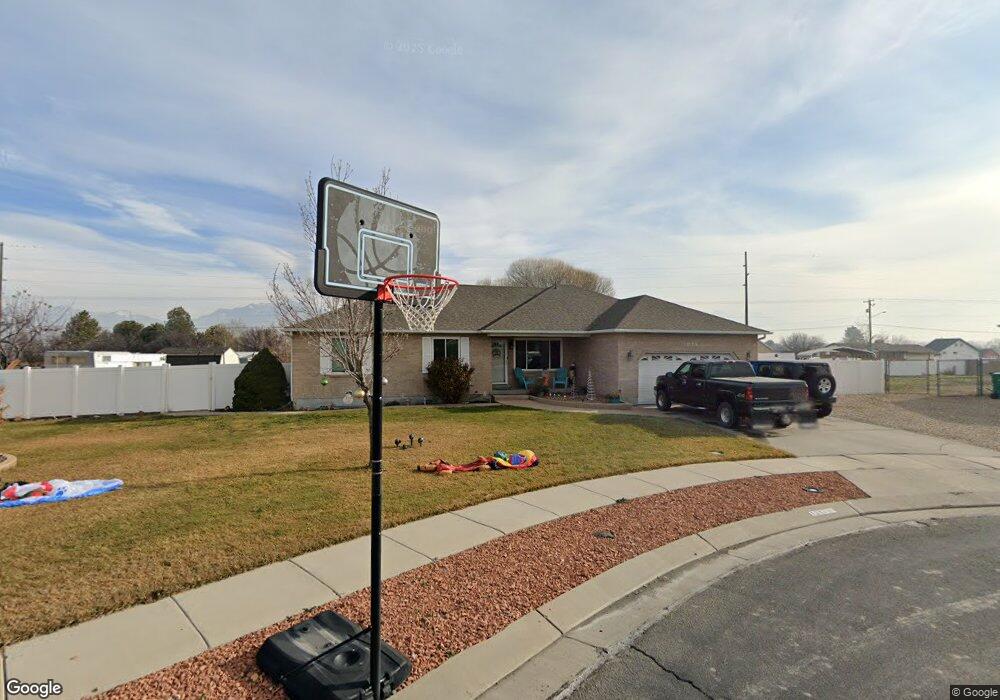
12173 S 2735 W Riverton, UT 84065
Estimated Value: $680,000 - $788,230
4
Beds
3
Baths
3,257
Sq Ft
$218/Sq Ft
Est. Value
About This Home
This home is located at 12173 S 2735 W, Riverton, UT 84065 and is currently estimated at $709,808, approximately $217 per square foot. 12173 S 2735 W is a home located in Salt Lake County with nearby schools including Rose Creek School, Oquirrh Hills Middle School, and Riverton High School.
Ownership History
Date
Name
Owned For
Owner Type
Purchase Details
Closed on
Sep 1, 2016
Sold by
Gadd Jason and Gadd Tayna
Bought by
Gadd Jason and Gadd Tanya
Current Estimated Value
Purchase Details
Closed on
Jun 17, 2016
Sold by
Christensen David T and Christensen Heidi M
Bought by
Gadd Jason and Gadd Tayna
Home Financials for this Owner
Home Financials are based on the most recent Mortgage that was taken out on this home.
Original Mortgage
$345,800
Outstanding Balance
$275,577
Interest Rate
3.61%
Mortgage Type
New Conventional
Estimated Equity
$434,231
Purchase Details
Closed on
Jun 25, 1999
Sold by
Ron Thorne Construction Inc
Bought by
Christensen David T and Christensen Heidi M
Home Financials for this Owner
Home Financials are based on the most recent Mortgage that was taken out on this home.
Original Mortgage
$188,100
Interest Rate
7.05%
Create a Home Valuation Report for This Property
The Home Valuation Report is an in-depth analysis detailing your home's value as well as a comparison with similar homes in the area
Home Values in the Area
Average Home Value in this Area
Purchase History
| Date | Buyer | Sale Price | Title Company |
|---|---|---|---|
| Gadd Jason | -- | Title One | |
| Gadd Jason | -- | Magellan Title | |
| Christensen David T | -- | Sutherland Title |
Source: Public Records
Mortgage History
| Date | Status | Borrower | Loan Amount |
|---|---|---|---|
| Open | Gadd Jason | $345,800 | |
| Previous Owner | Christensen David T | $188,100 |
Source: Public Records
Tax History Compared to Growth
Tax History
| Year | Tax Paid | Tax Assessment Tax Assessment Total Assessment is a certain percentage of the fair market value that is determined by local assessors to be the total taxable value of land and additions on the property. | Land | Improvement |
|---|---|---|---|---|
| 2025 | $3,818 | $675,200 | $293,300 | $381,900 |
| 2024 | $3,818 | $660,800 | $266,200 | $394,600 |
| 2023 | $4,011 | $654,400 | $263,500 | $390,900 |
| 2022 | $4,009 | $641,700 | $258,400 | $383,300 |
| 2021 | $3,401 | $484,700 | $167,600 | $317,100 |
| 2020 | $3,312 | $440,000 | $167,600 | $272,400 |
| 2019 | $3,295 | $430,400 | $167,600 | $262,800 |
| 2018 | $3,054 | $392,800 | $156,400 | $236,400 |
| 2017 | $2,879 | $360,800 | $156,400 | $204,400 |
| 2016 | $2,635 | $316,900 | $156,400 | $160,500 |
| 2015 | $2,527 | $294,600 | $155,000 | $139,600 |
| 2014 | $2,428 | $277,600 | $147,500 | $130,100 |
Source: Public Records
Map
Nearby Homes
- 2853 W 12075 S
- 12501 Falls Creek Rd
- 2511 W 11730 S
- 11716 S 2610 W
- 2356 W Montcalm Dr
- 11788 S Myers Park Ln Unit 101
- 2295 W Myers Ln
- 12658 Old Fort Cir
- 2626 W Midas Side Way
- 3168 Chalk Creek Way
- 2602 W 11625 S
- 11707 S Myers Park Ln Unit 111
- 2732 W Lizzi Cove
- 12034 S 1900 W
- 12580 S Janice Dr
- 11513 S Jackson Downs Way
- 2817 W 11460 St S Unit 203
- 11666 S Gold Dust Dr
- 3371 W Waterbridge Cove Unit 417
- 3376 W Water Crescent Place