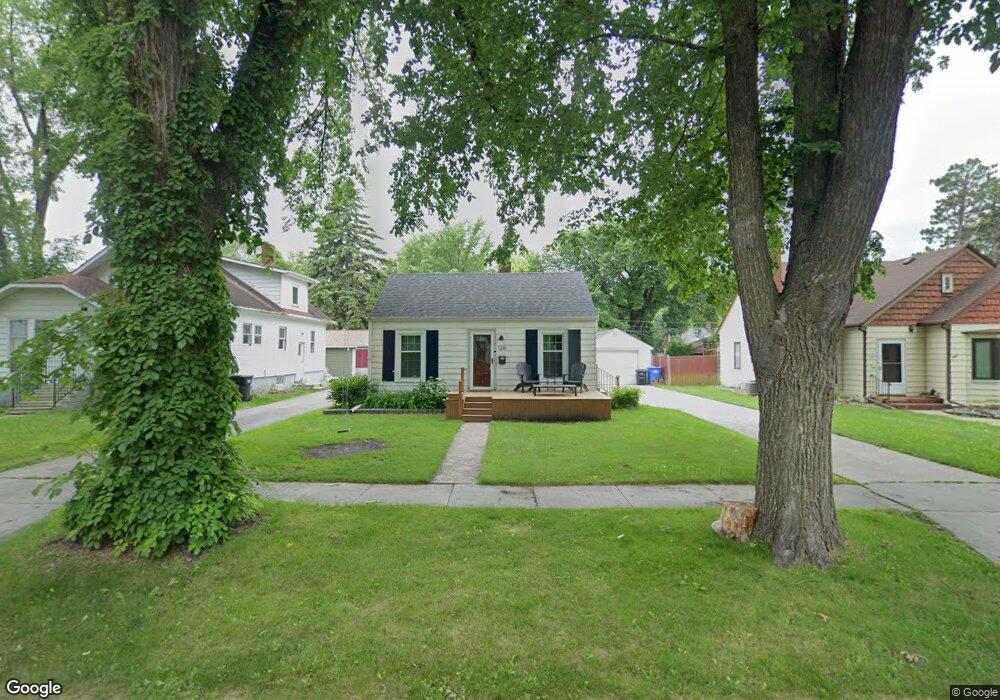
1218 7th St N Fargo, ND 58102
Roosevelt NeighborhoodEstimated Value: $178,625 - $185,000
2
Beds
1
Bath
624
Sq Ft
$290/Sq Ft
Est. Value
About This Home
This home is located at 1218 7th St N, Fargo, ND 58102 and is currently estimated at $180,906, approximately $289 per square foot. 1218 7th St N is a home located in Cass County with nearby schools including Horace Mann Roosevelt Elementary School, Ben Franklin Middle School, and North High School.
Ownership History
Date
Name
Owned For
Owner Type
Purchase Details
Closed on
Sep 15, 2025
Sold by
Heins Tyler J and Heins Nicole M
Bought by
Elijahs House Llc
Current Estimated Value
Purchase Details
Closed on
May 4, 2023
Sold by
Ford Ty J and Ford Elisha
Bought by
Heins Tyler J and Heins Nicole M
Home Financials for this Owner
Home Financials are based on the most recent Mortgage that was taken out on this home.
Original Mortgage
$144,000
Interest Rate
6.42%
Mortgage Type
New Conventional
Purchase Details
Closed on
Apr 25, 2014
Sold by
Hogan Teresa L
Bought by
Ford Ty J and Ford Elisha
Create a Home Valuation Report for This Property
The Home Valuation Report is an in-depth analysis detailing your home's value as well as a comparison with similar homes in the area
Home Values in the Area
Average Home Value in this Area
Purchase History
| Date | Buyer | Sale Price | Title Company |
|---|---|---|---|
| Elijahs House Llc | -- | Fm Title | |
| Heins Tyler J | $160,000 | Fm Title | |
| Ford Ty J | $92,750 | Fm Title |
Source: Public Records
Mortgage History
| Date | Status | Borrower | Loan Amount |
|---|---|---|---|
| Previous Owner | Heins Tyler J | $144,000 |
Source: Public Records
Tax History Compared to Growth
Tax History
| Year | Tax Paid | Tax Assessment Tax Assessment Total Assessment is a certain percentage of the fair market value that is determined by local assessors to be the total taxable value of land and additions on the property. | Land | Improvement |
|---|---|---|---|---|
| 2024 | $2,115 | $79,050 | $20,150 | $58,900 |
| 2023 | $2,604 | $79,050 | $20,150 | $58,900 |
| 2022 | $2,381 | $69,350 | $20,150 | $49,200 |
| 2021 | $2,287 | $61,900 | $20,150 | $41,750 |
| 2020 | $2,127 | $61,900 | $20,150 | $41,750 |
| 2019 | $2,079 | $60,100 | $11,950 | $48,150 |
| 2018 | $2,034 | $59,100 | $11,950 | $47,150 |
| 2017 | $1,901 | $56,300 | $11,950 | $44,350 |
| 2016 | $1,638 | $51,200 | $11,950 | $39,250 |
| 2015 | $1,718 | $51,200 | $8,200 | $43,000 |
| 2014 | $1,506 | $41,700 | $8,200 | $33,500 |
| 2013 | $1,444 | $39,700 | $8,200 | $31,500 |
Source: Public Records
Map
Nearby Homes