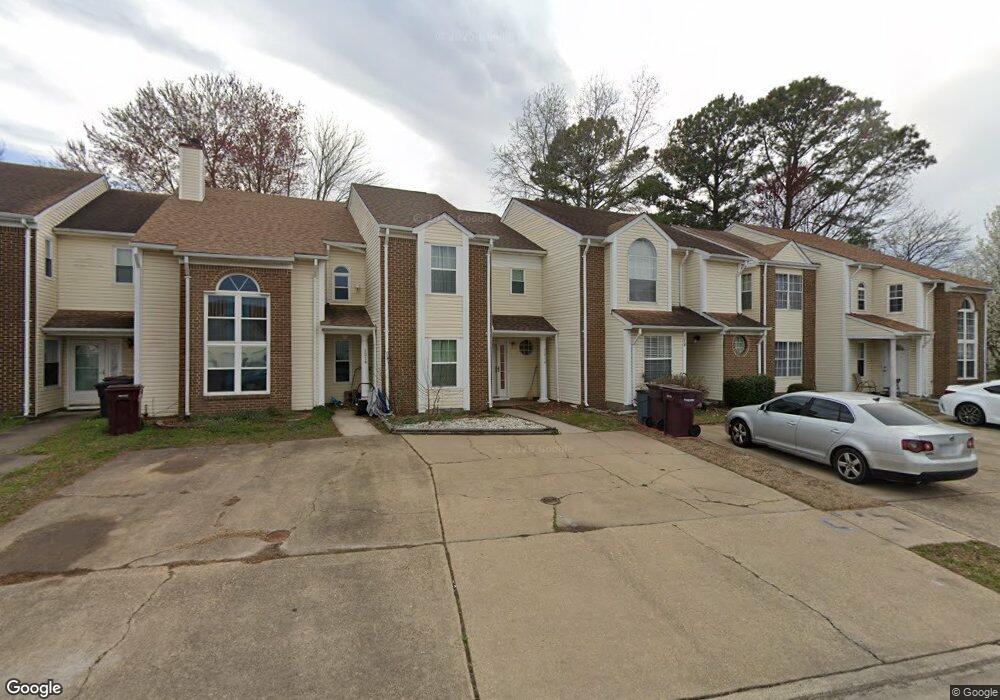
1218 Alder Ct Chesapeake, VA 23320
Greenbrier West NeighborhoodEstimated Value: $272,424 - $286,000
3
Beds
2
Baths
1,315
Sq Ft
$213/Sq Ft
Est. Value
About This Home
This home is located at 1218 Alder Ct, Chesapeake, VA 23320 and is currently estimated at $279,606, approximately $212 per square foot. 1218 Alder Ct is a home located in Chesapeake City with nearby schools including B.M. Williams Primary School, Crestwood Intermediate School, and Crestwood Middle School.
Ownership History
Date
Name
Owned For
Owner Type
Purchase Details
Closed on
Aug 23, 2018
Sold by
Gatlin Latasha E
Bought by
Harris Chelsie
Current Estimated Value
Home Financials for this Owner
Home Financials are based on the most recent Mortgage that was taken out on this home.
Original Mortgage
$163,975
Outstanding Balance
$142,778
Interest Rate
4.62%
Mortgage Type
FHA
Estimated Equity
$136,828
Purchase Details
Closed on
Mar 5, 2004
Sold by
Edwards Renee
Bought by
Gatlin Latasha
Home Financials for this Owner
Home Financials are based on the most recent Mortgage that was taken out on this home.
Original Mortgage
$107,500
Interest Rate
5.39%
Mortgage Type
New Conventional
Purchase Details
Closed on
May 2, 2000
Sold by
Cooke Dennis L
Bought by
Hudson-Clarke Renee
Home Financials for this Owner
Home Financials are based on the most recent Mortgage that was taken out on this home.
Original Mortgage
$71,021
Interest Rate
8.21%
Create a Home Valuation Report for This Property
The Home Valuation Report is an in-depth analysis detailing your home's value as well as a comparison with similar homes in the area
Home Values in the Area
Average Home Value in this Area
Purchase History
| Date | Buyer | Sale Price | Title Company |
|---|---|---|---|
| Harris Chelsie | $167,000 | Vintage Est Title & Escr Llc | |
| Gatlin Latasha | $109,000 | -- | |
| Hudson-Clarke Renee | $72,000 | -- |
Source: Public Records
Mortgage History
| Date | Status | Borrower | Loan Amount |
|---|---|---|---|
| Open | Harris Chelsie | $163,975 | |
| Previous Owner | Gatlin Latasha | $107,500 | |
| Previous Owner | Hudson-Clarke Renee | $71,021 |
Source: Public Records
Tax History Compared to Growth
Tax History
| Year | Tax Paid | Tax Assessment Tax Assessment Total Assessment is a certain percentage of the fair market value that is determined by local assessors to be the total taxable value of land and additions on the property. | Land | Improvement |
|---|---|---|---|---|
| 2025 | $2,467 | $260,500 | $100,000 | $160,500 |
| 2024 | $2,467 | $244,300 | $95,000 | $149,300 |
| 2023 | $1,965 | $223,000 | $85,000 | $138,000 |
| 2022 | $1,923 | $190,400 | $70,000 | $120,400 |
| 2021 | $1,760 | $167,600 | $55,000 | $112,600 |
| 2020 | $1,656 | $157,700 | $50,000 | $107,700 |
| 2019 | $1,618 | $154,100 | $50,000 | $104,100 |
| 2018 | $1,534 | $148,800 | $60,000 | $88,800 |
| 2017 | $1,562 | $148,800 | $60,000 | $88,800 |
| 2016 | $1,562 | $148,800 | $60,000 | $88,800 |
| 2015 | $1,562 | $148,800 | $60,000 | $88,800 |
| 2014 | $1,562 | $148,800 | $60,000 | $88,800 |
Source: Public Records
Map
Nearby Homes
- 1239 Basswood Ct
- 1209 Alder Ct
- 1210 Damyien Arch
- 317 Shadowlake Dr
- 113 Cottonwood Ln
- 200 Essex Dr
- 1120 Chesslawn Cir E
- 404 Kings Bishop Ct
- 411 Prince Michael Ct
- 412 Prince Phillip Ct
- 948 Hollywood Dr
- 908 Englewood Dr
- 616 Lord Nelson Ct
- 1509 Waitsel Dr Unit 204
- 512 Rosewood Terrace
- 412 Knells Ridge Dr
- 1018 Mathews Dr
- 924 Wickford Dr
- 918 Wickford Dr
- 508 Rue Saint La Rogue
- 1220 Alder Ct
- 1216 Alder Ct
- 1222 Alder Ct
- 1214 Alder Ct
- 1212 Alder Ct
- 1243 Basswood Ct
- 1210 Alder Ct
- 1245 Basswood Ct
- 1247 Basswood Ct
- 1237 Basswood Ct
- 1208 Alder Ct
- 1235 Basswood Ct
- 1233 Basswood Ct
- 1206 Alder Ct
- 1202 Alder Ct
- 1225 Basswood Ct
- 1204 Alder Ct
- 1221 Alder Ct
- 1223 Basswood Ct
- 1200 Alder Ct