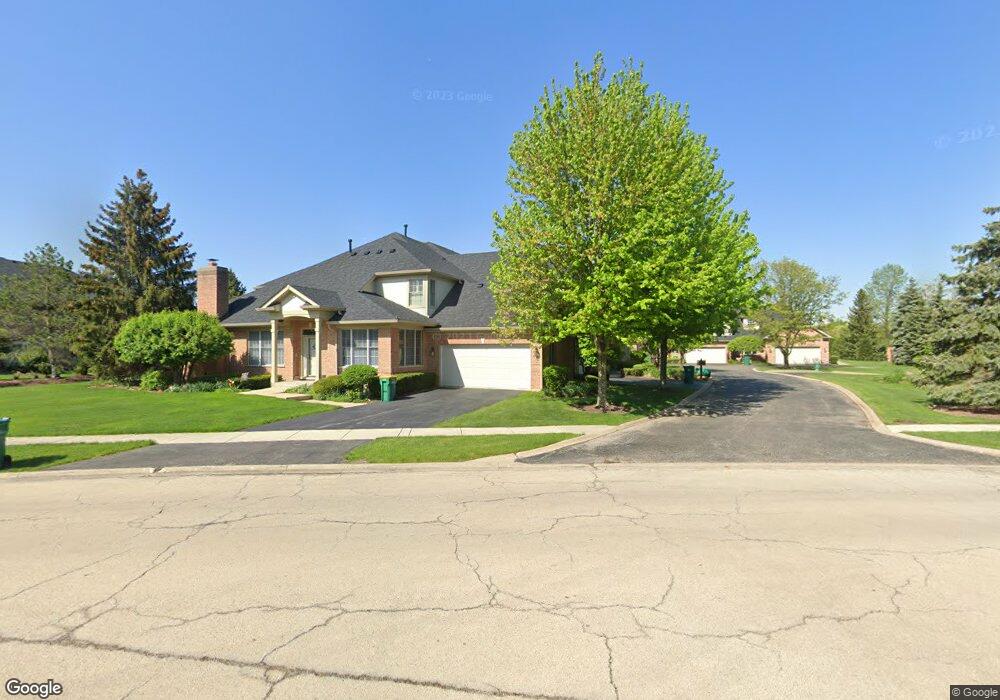
1218 Ashbury Dr Unit 31218 Lemont, IL 60439
Southeast Lemont NeighborhoodEstimated Value: $471,649 - $509,000
2
Beds
3
Baths
2,200
Sq Ft
$224/Sq Ft
Est. Value
About This Home
This home is located at 1218 Ashbury Dr Unit 31218, Lemont, IL 60439 and is currently estimated at $491,912, approximately $223 per square foot. 1218 Ashbury Dr Unit 31218 is a home located in Cook County with nearby schools including Oakwood School, River Valley School, and Old Quarry Middle School.
Ownership History
Date
Name
Owned For
Owner Type
Purchase Details
Closed on
Mar 20, 2015
Sold by
Lekousis Phillip A
Bought by
Levato Diane
Current Estimated Value
Purchase Details
Closed on
Aug 20, 2009
Sold by
Aw5 Development Llc
Bought by
Lekousis Philip A
Home Financials for this Owner
Home Financials are based on the most recent Mortgage that was taken out on this home.
Original Mortgage
$372,913
Interest Rate
5.28%
Mortgage Type
FHA
Purchase Details
Closed on
Jun 25, 2008
Sold by
Ashbury Woods Development Llc
Bought by
Aw5 Development Llc
Home Financials for this Owner
Home Financials are based on the most recent Mortgage that was taken out on this home.
Original Mortgage
$4,500,000
Interest Rate
6.1%
Mortgage Type
Unknown
Create a Home Valuation Report for This Property
The Home Valuation Report is an in-depth analysis detailing your home's value as well as a comparison with similar homes in the area
Home Values in the Area
Average Home Value in this Area
Purchase History
| Date | Buyer | Sale Price | Title Company |
|---|---|---|---|
| Levato Diane | $335,000 | Fidelity National Title | |
| Lekousis Philip A | $380,000 | Cti | |
| Aw5 Development Llc | -- | Cti |
Source: Public Records
Mortgage History
| Date | Status | Borrower | Loan Amount |
|---|---|---|---|
| Previous Owner | Lekousis Philip A | $372,913 | |
| Previous Owner | Aw5 Development Llc | $4,500,000 |
Source: Public Records
Tax History Compared to Growth
Tax History
| Year | Tax Paid | Tax Assessment Tax Assessment Total Assessment is a certain percentage of the fair market value that is determined by local assessors to be the total taxable value of land and additions on the property. | Land | Improvement |
|---|---|---|---|---|
| 2024 | $7,416 | $39,000 | $1,459 | $37,541 |
| 2023 | $6,617 | $39,000 | $1,459 | $37,541 |
| 2022 | $6,617 | $30,674 | $1,290 | $29,384 |
| 2021 | $6,435 | $30,673 | $1,290 | $29,383 |
| 2020 | $6,557 | $30,673 | $1,290 | $29,383 |
| 2019 | $6,623 | $32,062 | $1,290 | $30,772 |
| 2018 | $6,512 | $32,062 | $1,290 | $30,772 |
| 2017 | $6,751 | $33,500 | $1,290 | $32,210 |
| 2016 | $5,599 | $26,214 | $1,065 | $25,149 |
| 2015 | $5,653 | $26,214 | $1,065 | $25,149 |
| 2014 | $6,248 | $28,396 | $1,065 | $27,331 |
| 2013 | $5,872 | $28,461 | $1,065 | $27,396 |
Source: Public Records
Map
Nearby Homes
- 1213 Prairie Ln
- 1200 Prairie Ln Unit 1-A
- 1224 Prairie Ln
- 1228 Prairie Ln Unit 4B
- 1228 Prairie Ln
- 1232 Prairie Ln Unit 5-A
- 1236 Prairie Ln Unit 5-B
- 1408 Ashbury Dr
- 1341 Ashbury Cir
- 1409 Notting Hill Dr
- 1382 Overton Dr
- 12830 Marble St Unit 25A
- Fremont Plan at Covington Knolls
- Eden Plan at Covington Knolls
- Danbury Plan at Covington Knolls
- Calysta Plan at Covington Knolls
- Briarcliffe Plan at Covington Knolls
- Amberwood Plan at Covington Knolls
- 12853 Marble St Unit 27A
- 15500 E 127th St
- 1222 Ashbury Dr
- 1214 Ashbury Dr
- 1214 Ashbury Dr Unit 12
- 1226 Ashbury Dr Unit 31226
- 1212 Ashbury Dr
- 1208 Ashbury Dr Unit 41208
- 430 Ashbury Ln
- 1204 Ashbury Dr Unit 41204
- 426 Ashbury Ln Unit 6426
- 510 Ashbury Ln Unit 5510
- 1200 Ashbury Dr
- 514 Ashbury Ln
- 513 Ashbury Ct
- 513 Ashbury Ct
- 518 Ashbury Ln
- 522 Ashbury Ln Unit 5522
- 418 Ashbury Ct
- 1201 Ashbury Dr
- 1205 Ashbury Dr
- 15236 E 127th St