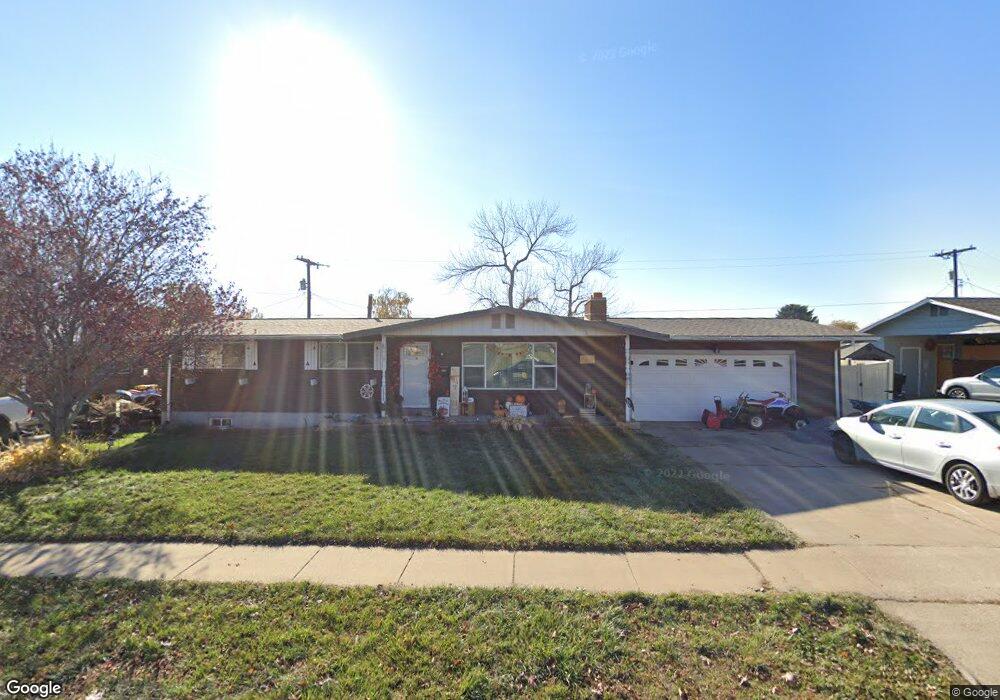
1218 E 1100 S Clearfield, UT 84015
Estimated Value: $426,000 - $438,000
4
Beds
2
Baths
2,350
Sq Ft
$183/Sq Ft
Est. Value
About This Home
This home is located at 1218 E 1100 S, Clearfield, UT 84015 and is currently estimated at $431,040, approximately $183 per square foot. 1218 E 1100 S is a home located in Davis County with nearby schools including South Clearfield Elementary School, North Davis Junior High School, and Clearfield High School.
Ownership History
Date
Name
Owned For
Owner Type
Purchase Details
Closed on
May 12, 2021
Sold by
Handy Grant
Bought by
Handy Grant O and Handy Wendy
Current Estimated Value
Home Financials for this Owner
Home Financials are based on the most recent Mortgage that was taken out on this home.
Original Mortgage
$279,000
Outstanding Balance
$250,139
Interest Rate
3.1%
Mortgage Type
New Conventional
Estimated Equity
$180,901
Purchase Details
Closed on
Jan 14, 2010
Sold by
Handy Grant Owen
Bought by
Handy Grant O and Handy Wendy
Home Financials for this Owner
Home Financials are based on the most recent Mortgage that was taken out on this home.
Original Mortgage
$146,825
Interest Rate
5.25%
Mortgage Type
FHA
Purchase Details
Closed on
Dec 22, 1999
Sold by
Manning Lynn G and Manning Diane
Bought by
Handy Grant O and Handy Wendy
Home Financials for this Owner
Home Financials are based on the most recent Mortgage that was taken out on this home.
Original Mortgage
$101,150
Interest Rate
10.7%
Create a Home Valuation Report for This Property
The Home Valuation Report is an in-depth analysis detailing your home's value as well as a comparison with similar homes in the area
Home Values in the Area
Average Home Value in this Area
Purchase History
| Date | Buyer | Sale Price | Title Company |
|---|---|---|---|
| Handy Grant O | -- | Accommodation | |
| Handy Grant | -- | Backman Title Services | |
| Handy Grant O | -- | Accommodation | |
| Handy Grant Owen | -- | Equity Title Ins Agency Inc | |
| Handy Grant O | -- | Mountain View Title & Escrow |
Source: Public Records
Mortgage History
| Date | Status | Borrower | Loan Amount |
|---|---|---|---|
| Open | Handy Grant | $279,000 | |
| Previous Owner | Handy Grant Owen | $146,825 | |
| Previous Owner | Handy Grant O | $101,150 | |
| Closed | Handy Grant O | $17,850 |
Source: Public Records
Tax History
| Year | Tax Paid | Tax Assessment Tax Assessment Total Assessment is a certain percentage of the fair market value that is determined by local assessors to be the total taxable value of land and additions on the property. | Land | Improvement |
|---|---|---|---|---|
| 2025 | $2,400 | $215,050 | $75,188 | $139,862 |
| 2024 | $2,315 | $209,000 | $71,862 | $137,138 |
| 2023 | $2,100 | $348,000 | $114,709 | $233,291 |
| 2022 | $2,277 | $204,050 | $65,519 | $138,531 |
| 2021 | $2,061 | $279,000 | $71,012 | $207,988 |
| 2020 | $1,711 | $230,000 | $59,995 | $170,005 |
| 2019 | $1,657 | $220,000 | $61,869 | $158,131 |
| 2018 | $1,516 | $196,000 | $52,169 | $143,831 |
| 2016 | $1,338 | $90,475 | $22,033 | $68,442 |
| 2015 | $1,312 | $84,590 | $22,033 | $62,557 |
| 2014 | $1,256 | $82,034 | $22,033 | $60,001 |
| 2013 | -- | $81,950 | $30,324 | $51,626 |
Source: Public Records
Map
Nearby Homes
- 1127 E 1050 S
- 1612 E 925 S
- 897 E 1000 S
- 846 S 1625 E Unit C
- 1543 E 750 S Unit C5
- 732 E 1000 S
- 1644 E 700 S
- 1916 N Celia Way
- 1870 N Celia Way
- 1883 W 1575 N
- 1847 John St
- 1888 W 1575 N Unit 235
- 1888 W 1575 N
- 1858 W 1575 N Unit 240
- 1858 W 1575 N
- 908 S 550 E
- 1740 N Gregory Dr
- 564 S 800 E
- 1896 Cliff Place
- 1498 W 1850 N
Your Personal Tour Guide
Ask me questions while you tour the home.