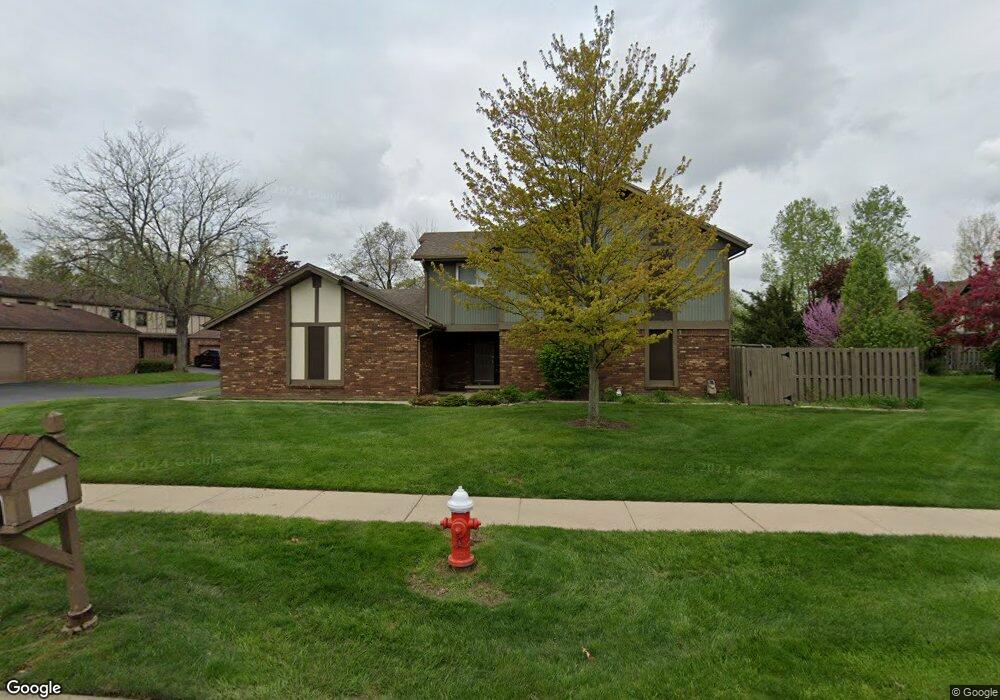
1218 Hidden Ridge Rd Unit B Toledo, OH 43615
Reynolds Corners NeighborhoodEstimated Value: $144,000 - $163,000
2
Beds
2
Baths
1,348
Sq Ft
$115/Sq Ft
Est. Value
About This Home
This home is located at 1218 Hidden Ridge Rd Unit B, Toledo, OH 43615 and is currently estimated at $154,650, approximately $114 per square foot. 1218 Hidden Ridge Rd Unit B is a home located in Lucas County with nearby schools including Holland Elementary School, Springfield Middle School, and Springfield High School.
Ownership History
Date
Name
Owned For
Owner Type
Purchase Details
Closed on
Mar 4, 2002
Sold by
Vanwey Gregory S
Bought by
Vanwey Cynthia M
Current Estimated Value
Purchase Details
Closed on
Nov 15, 2001
Sold by
Wiodarz Tamara M
Bought by
Vanwey Cynthia
Home Financials for this Owner
Home Financials are based on the most recent Mortgage that was taken out on this home.
Original Mortgage
$71,500
Outstanding Balance
$27,781
Interest Rate
6.64%
Mortgage Type
Purchase Money Mortgage
Estimated Equity
$126,869
Purchase Details
Closed on
Feb 2, 1995
Sold by
Rees Erica S
Bought by
Brown Richard G
Home Financials for this Owner
Home Financials are based on the most recent Mortgage that was taken out on this home.
Original Mortgage
$51,500
Interest Rate
7.88%
Mortgage Type
New Conventional
Purchase Details
Closed on
Aug 20, 1993
Sold by
Dold William H and Mary Lou
Create a Home Valuation Report for This Property
The Home Valuation Report is an in-depth analysis detailing your home's value as well as a comparison with similar homes in the area
Home Values in the Area
Average Home Value in this Area
Purchase History
| Date | Buyer | Sale Price | Title Company |
|---|---|---|---|
| Vanwey Cynthia M | -- | -- | |
| Vanwey Cynthia | $96,500 | American 1St | |
| Brown Richard G | $71,500 | -- | |
| -- | $67,000 | -- |
Source: Public Records
Mortgage History
| Date | Status | Borrower | Loan Amount |
|---|---|---|---|
| Open | Vanwey Cynthia | $71,500 | |
| Previous Owner | Brown Richard G | $51,500 |
Source: Public Records
Tax History Compared to Growth
Tax History
| Year | Tax Paid | Tax Assessment Tax Assessment Total Assessment is a certain percentage of the fair market value that is determined by local assessors to be the total taxable value of land and additions on the property. | Land | Improvement |
|---|---|---|---|---|
| 2024 | $1,025 | $38,535 | $9,555 | $28,980 |
| 2023 | $1,611 | $25,655 | $7,000 | $18,655 |
| 2022 | $1,607 | $25,655 | $7,000 | $18,655 |
| 2021 | $1,647 | $25,655 | $7,000 | $18,655 |
| 2020 | $2,528 | $35,945 | $4,025 | $31,920 |
| 2019 | $2,465 | $35,945 | $4,025 | $31,920 |
| 2018 | $2,509 | $35,945 | $4,025 | $31,920 |
| 2017 | $2,559 | $35,105 | $3,920 | $31,185 |
| 2016 | $2,593 | $100,300 | $11,200 | $89,100 |
| 2015 | $2,590 | $100,300 | $11,200 | $89,100 |
| 2014 | $2,331 | $35,110 | $3,920 | $31,190 |
| 2013 | $2,331 | $35,110 | $3,920 | $31,190 |
Source: Public Records
Map
Nearby Homes
- 1187 Hidden Ridge Rd Unit A
- 1183 Hidden Ridge Rd
- 1144 Bernath Pkwy Unit D
- 5662 Bernath Ct Unit E
- 5705 Aspen Dr
- 5615 Baronswood Cir
- 5560 Greenridge Dr
- 1533 Eaglebrook Rd
- 1562 Saddlebrook Ct Unit B
- 715 S Holland Sylvania Rd
- 5702 Angola Rd
- 5222 Mardone Dr
- 5150 Norton Place
- 5860 Cresthaven Ln
- 5026 Geer Ln
- 1104 S Reynolds Rd
- 38 Walnut Creek Dr
- 6032 Willowvale Dr
- 4866 Airport Hwy
- 640 Quigley St
- 1216 Hidden Ridge Rd Unit 17
- 1220 Hidden Ridge Rd Unit A
- 1216 Hidden Ridge Rd Unit C
- 1214 Hidden Ridge Rd Unit D
- 1212 Hidden Ridge Rd Unit E
- 1202 Hidden Ridge Rd Unit D
- 1204 Hidden Ridge Rd Unit C
- 1208 Hidden Ridge Rd Unit A
- 1206 Hidden Ridge Rd Unit B
- 1208 Hidden Ridge Rd
- 1186 Hidden Ridge Rd Unit E
- 1184 Hidden Ridge Rd Unit F
- 1209 Treetop Ct
- 1172 Hidden Ridge Rd
- 1172 Hidden Ridge Rd Unit A
- 1182 Hidden Ridge Rd Unit G
- 1217 Treetop Ct
- 1203 Treetop Ct
- 1178 Hidden Ridge Rd Unit D
- 1176 Hidden Ridge Rd Unit C