Estimated Value: $271,000 - $309,000
3
Beds
1
Bath
1,080
Sq Ft
$267/Sq Ft
Est. Value
About This Home
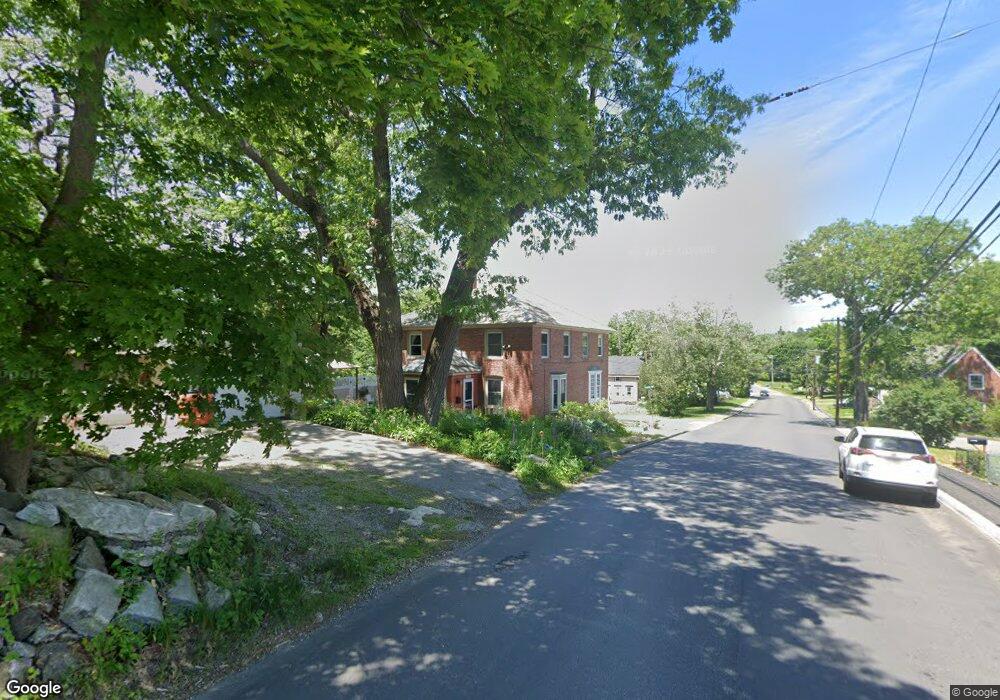
This home is located at 1218 High St, Bath, ME 04530 and is currently estimated at $288,881, approximately $267 per square foot. 1218 High St is a home located in Sagadahoc County with nearby schools including Morse High School and Hyde School.
Ownership History
Date
Name
Owned For
Owner Type
Purchase Details
Closed on
Jul 8, 2020
Sold by
Msp Prop 1 Ledgeview Llc
Bought by
Ledgeview Apartments Llc
Current Estimated Value
Home Financials for this Owner
Home Financials are based on the most recent Mortgage that was taken out on this home.
Original Mortgage
$1,522,500
Outstanding Balance
$1,337,951
Interest Rate
3.1%
Mortgage Type
Purchase Money Mortgage
Estimated Equity
-$1,049,070
Purchase Details
Closed on
Jul 5, 2011
Sold by
Gosse Bryan D
Bought by
Hill Phyllis
Home Financials for this Owner
Home Financials are based on the most recent Mortgage that was taken out on this home.
Original Mortgage
$69,750
Interest Rate
4.62%
Mortgage Type
Purchase Money Mortgage
Create a Home Valuation Report for This Property
The Home Valuation Report is an in-depth analysis detailing your home's value as well as a comparison with similar homes in the area
Home Values in the Area
Average Home Value in this Area
Purchase History
| Date | Buyer | Sale Price | Title Company |
|---|---|---|---|
| Ledgeview Apartments Llc | -- | None Available | |
| Ledgeview Apartments Llc | -- | None Available | |
| Hill Phyllis | -- | -- | |
| Hill Phyllis | -- | -- |
Source: Public Records
Mortgage History
| Date | Status | Borrower | Loan Amount |
|---|---|---|---|
| Open | Ledgeview Apartments Llc | $1,522,500 | |
| Closed | Ledgeview Apartments Llc | $1,522,500 | |
| Previous Owner | Hill Phyllis | $69,750 |
Source: Public Records
Tax History
| Year | Tax Paid | Tax Assessment Tax Assessment Total Assessment is a certain percentage of the fair market value that is determined by local assessors to be the total taxable value of land and additions on the property. | Land | Improvement |
|---|---|---|---|---|
| 2025 | $3,569 | $221,700 | $62,000 | $159,700 |
| 2024 | $3,257 | $197,400 | $59,100 | $138,300 |
| 2023 | $3,045 | $180,200 | $51,700 | $128,500 |
| 2022 | $2,725 | $133,600 | $32,000 | $101,600 |
| 2021 | $2,712 | $133,600 | $32,000 | $101,600 |
| 2020 | $2,672 | $133,600 | $32,000 | $101,600 |
| 2019 | $2,645 | $133,600 | $32,000 | $101,600 |
| 2018 | $1,938 | $88,900 | $21,800 | $67,100 |
| 2017 | $1,898 | $88,900 | $21,800 | $67,100 |
| 2016 | $1,876 | $88,900 | $21,800 | $67,100 |
| 2015 | $1,840 | $88,900 | $21,800 | $67,100 |
| 2014 | $1,796 | $88,900 | $21,800 | $67,100 |
| 2013 | $1,746 | $88,900 | $21,800 | $67,100 |
Source: Public Records
Map
Nearby Homes
Your Personal Tour Guide
Ask me questions while you tour the home.