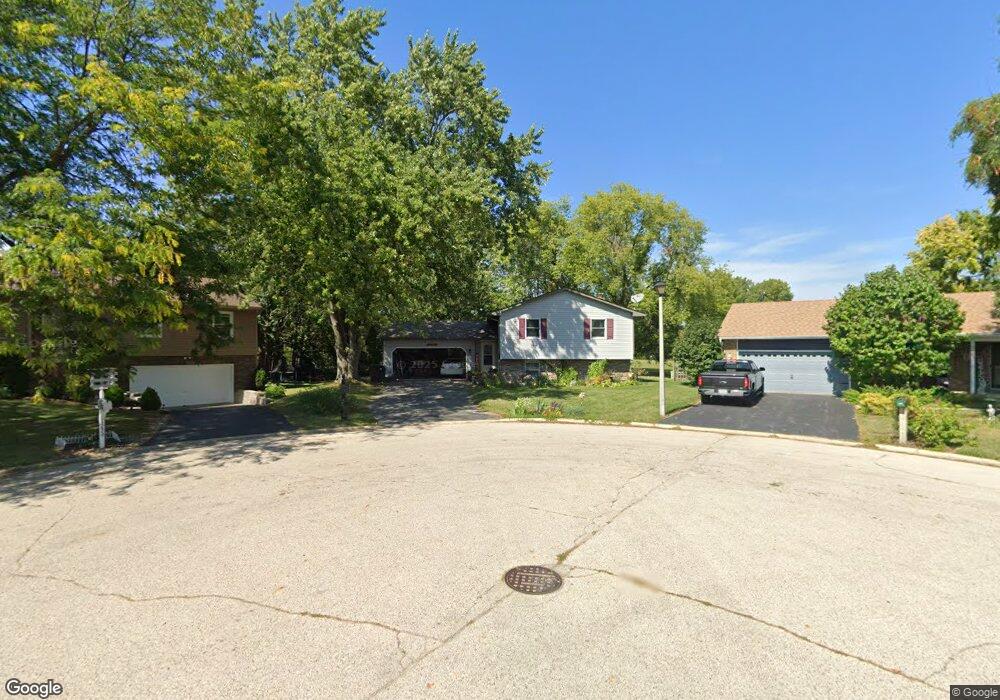
1218 Mark Ct Woodstock, IL 60098
Estimated Value: $257,000 - $282,651
4
Beds
2
Baths
1,025
Sq Ft
$267/Sq Ft
Est. Value
About This Home
This home is located at 1218 Mark Ct, Woodstock, IL 60098 and is currently estimated at $273,663, approximately $266 per square foot. 1218 Mark Ct is a home located in McHenry County with nearby schools including Dean Street Elementary School, Creekside Middle School, and Woodstock High School.
Ownership History
Date
Name
Owned For
Owner Type
Purchase Details
Closed on
Jul 25, 2023
Sold by
James J Skozek Declaration Of Trust and Deborah A Skozek Declaration Of Trust
Bought by
Deborah A Skozek Declaration Of Trust and Skozek
Current Estimated Value
Purchase Details
Closed on
Jan 29, 2016
Sold by
Skozek James J and Skozek Deborah A
Bought by
Skozek Deborah A and Deborah A Skozek Declaration Of Trust
Purchase Details
Closed on
Jan 4, 2001
Sold by
Harris Trust & Svgs Bank
Bought by
Skozek James J and Skozek Deborah A
Home Financials for this Owner
Home Financials are based on the most recent Mortgage that was taken out on this home.
Original Mortgage
$112,500
Interest Rate
7.07%
Purchase Details
Closed on
Oct 29, 1997
Sold by
Lewellyn John W and Lewellyn Kathleen
Bought by
Harris Bank Woodstock and Trust #4922
Create a Home Valuation Report for This Property
The Home Valuation Report is an in-depth analysis detailing your home's value as well as a comparison with similar homes in the area
Home Values in the Area
Average Home Value in this Area
Purchase History
| Date | Buyer | Sale Price | Title Company |
|---|---|---|---|
| Deborah A Skozek Declaration Of Trust | -- | None Listed On Document | |
| Skozek Deborah A | -- | Stewart Title | |
| Skozek James J | -- | Stewart Title | |
| Skozek James J | -- | -- | |
| Harris Bank Woodstock | $98,500 | Universal Title Services Inc |
Source: Public Records
Mortgage History
| Date | Status | Borrower | Loan Amount |
|---|---|---|---|
| Previous Owner | Skozek James J | $112,500 |
Source: Public Records
Tax History Compared to Growth
Tax History
| Year | Tax Paid | Tax Assessment Tax Assessment Total Assessment is a certain percentage of the fair market value that is determined by local assessors to be the total taxable value of land and additions on the property. | Land | Improvement |
|---|---|---|---|---|
| 2024 | $5,379 | $74,382 | $12,039 | $62,343 |
| 2023 | $5,308 | $70,263 | $10,887 | $59,376 |
| 2022 | $5,295 | $62,356 | $9,662 | $52,694 |
| 2021 | $4,988 | $58,260 | $9,027 | $49,233 |
| 2020 | $4,766 | $55,360 | $8,578 | $46,782 |
| 2019 | $5,797 | $52,844 | $8,188 | $44,656 |
| 2018 | $5,287 | $47,433 | $9,340 | $38,093 |
| 2017 | $5,221 | $44,643 | $8,791 | $35,852 |
| 2016 | $5,217 | $41,336 | $8,140 | $33,196 |
| 2013 | -- | $38,885 | $7,508 | $31,377 |
Source: Public Records
Map
Nearby Homes
- 155 Lee Ann Ln
- 908 Bunker St
- 421 W Kimball Ave
- 331 Chestnut St
- 104 Stewart Ave
- 125 Forest Ave
- 1380 Sandpiper Ln
- 601 S Jefferson St
- 415 Dean St
- 434 Lake Ave
- 330 Lake Ave
- 2007 Edgewood Dr
- 1288 Prairie Ridge Trail
- 3848 Riverwoods Dr
- 3902 Riverwoods Dr
- 3842 Riverwoods Dr
- 3839 Riverwoods Dr
- Townsend Plan at Clublands of Antioch - Horizon Series
- Napa Plan at Clublands of Antioch - Andare Series
- 1249 Prairie Ridge Trail