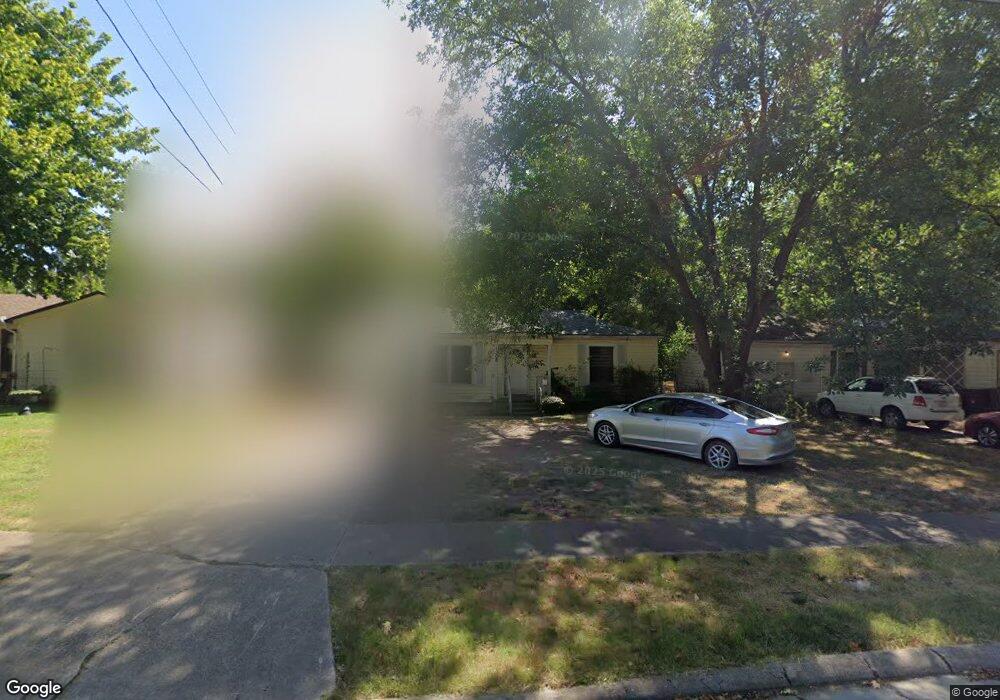
1218 Pecan St Bonham, TX 75418
Estimated Value: $154,558 - $220,000
--
Bed
1
Bath
1,724
Sq Ft
$110/Sq Ft
Est. Value
About This Home
This home is located at 1218 Pecan St, Bonham, TX 75418 and is currently estimated at $190,140, approximately $110 per square foot. 1218 Pecan St is a home located in Fannin County with nearby schools including Finley-Oates Elementary School, LH Rather Jr High School, and Bonham High School.
Ownership History
Date
Name
Owned For
Owner Type
Purchase Details
Closed on
Feb 7, 2007
Sold by
Oreal Inc
Bought by
Roy And Lynda Floyd Revocable Family Tru
Current Estimated Value
Home Financials for this Owner
Home Financials are based on the most recent Mortgage that was taken out on this home.
Original Mortgage
$96,400
Outstanding Balance
$57,251
Interest Rate
6.19%
Estimated Equity
$132,889
Create a Home Valuation Report for This Property
The Home Valuation Report is an in-depth analysis detailing your home's value as well as a comparison with similar homes in the area
Home Values in the Area
Average Home Value in this Area
Purchase History
| Date | Buyer | Sale Price | Title Company |
|---|---|---|---|
| Roy And Lynda Floyd Revocable Family Tru | -- | Cole Title Co |
Source: Public Records
Mortgage History
| Date | Status | Borrower | Loan Amount |
|---|---|---|---|
| Open | Roy And Lynda Floyd Revocable Family Tru | $96,400 |
Source: Public Records
Tax History Compared to Growth
Tax History
| Year | Tax Paid | Tax Assessment Tax Assessment Total Assessment is a certain percentage of the fair market value that is determined by local assessors to be the total taxable value of land and additions on the property. | Land | Improvement |
|---|---|---|---|---|
| 2025 | $2,519 | $137,180 | $49,920 | $87,260 |
| 2024 | $2,519 | $129,860 | $48,000 | $81,860 |
| 2023 | $2,514 | $127,490 | $44,160 | $83,330 |
| 2022 | $2,573 | $117,000 | $31,200 | $85,800 |
| 2021 | $1,870 | $74,000 | $12,885 | $61,115 |
| 2020 | $1,707 | $66,765 | $10,138 | $56,627 |
| 2019 | $1,997 | $75,130 | $7,080 | $68,050 |
| 2018 | $1,247 | $47,000 | $7,080 | $39,920 |
| 2017 | $1,211 | $47,380 | $6,840 | $40,540 |
| 2016 | $1,204 | $47,100 | $6,840 | $40,260 |
| 2015 | -- | $44,490 | $6,600 | $37,890 |
| 2014 | -- | $41,670 | $6,480 | $35,190 |
Source: Public Records
Map
Nearby Homes