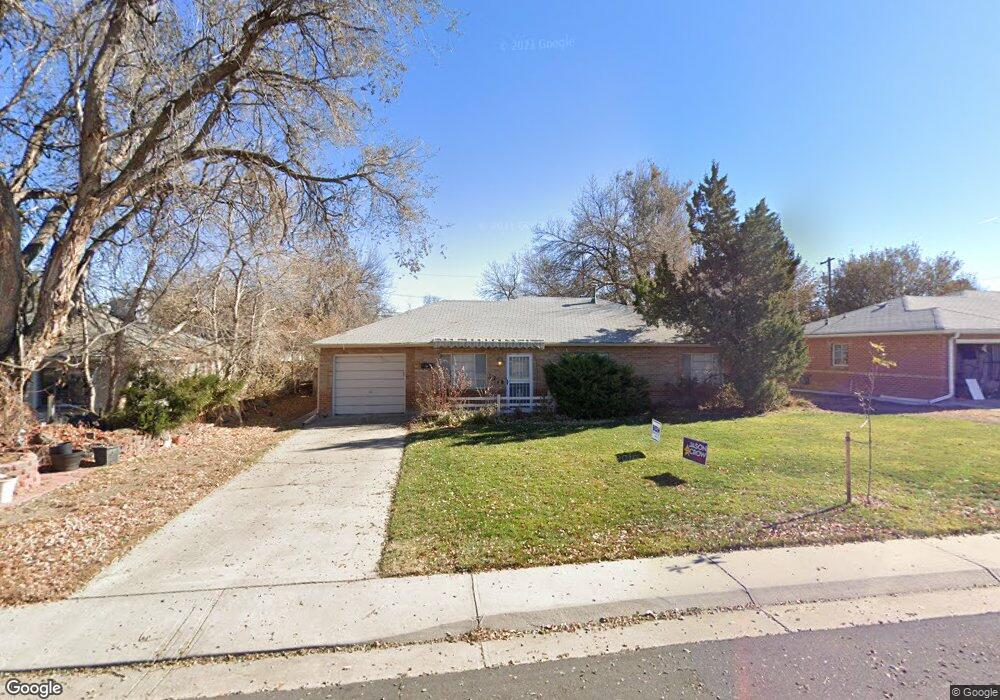
1218 Quari St Aurora, CO 80011
Hoffman Heights NeighborhoodEstimated Value: $359,000 - $397,000
3
Beds
3
Baths
1,401
Sq Ft
$274/Sq Ft
Est. Value
About This Home
This home is located at 1218 Quari St, Aurora, CO 80011 and is currently estimated at $383,676, approximately $273 per square foot. 1218 Quari St is a home located in Arapahoe County with nearby schools including Vaughn Elementary School, Lincoln Elementary School, and Del Mar Academy.
Ownership History
Date
Name
Owned For
Owner Type
Purchase Details
Closed on
Jun 17, 2014
Sold by
Good Donna M and Good Stephen L
Bought by
The Donna Mullen Good Trust and The Stephen L Good Trust
Current Estimated Value
Purchase Details
Closed on
Nov 16, 2009
Sold by
Yaseen Virginia D
Bought by
Good Stephen L and Good Donna M
Home Financials for this Owner
Home Financials are based on the most recent Mortgage that was taken out on this home.
Original Mortgage
$82,500
Outstanding Balance
$53,593
Interest Rate
4.9%
Mortgage Type
New Conventional
Estimated Equity
$330,083
Purchase Details
Closed on
Jul 14, 1993
Sold by
Elizabeth Dumler
Bought by
Yaseen Virginia D
Purchase Details
Closed on
May 20, 1992
Sold by
Conversion Arapco
Bought by
Elizabeth Dumler
Purchase Details
Closed on
May 1, 1983
Sold by
Conversion Arapco
Bought by
Conversion Arapco
Purchase Details
Closed on
Jul 4, 1776
Bought by
Conversion Arapco
Create a Home Valuation Report for This Property
The Home Valuation Report is an in-depth analysis detailing your home's value as well as a comparison with similar homes in the area
Home Values in the Area
Average Home Value in this Area
Purchase History
| Date | Buyer | Sale Price | Title Company |
|---|---|---|---|
| The Donna Mullen Good Trust | -- | None Available | |
| Good Stephen L | $110,000 | Land Title Guarantee Company | |
| Yaseen Virginia D | -- | -- | |
| Elizabeth Dumler | -- | -- | |
| Conversion Arapco | -- | -- | |
| Conversion Arapco | -- | -- |
Source: Public Records
Mortgage History
| Date | Status | Borrower | Loan Amount |
|---|---|---|---|
| Open | Good Stephen L | $82,500 |
Source: Public Records
Tax History Compared to Growth
Tax History
| Year | Tax Paid | Tax Assessment Tax Assessment Total Assessment is a certain percentage of the fair market value that is determined by local assessors to be the total taxable value of land and additions on the property. | Land | Improvement |
|---|---|---|---|---|
| 2024 | $1,976 | $21,259 | -- | -- |
| 2023 | $1,976 | $21,259 | $0 | $0 |
| 2022 | $1,941 | $19,335 | $0 | $0 |
| 2021 | $2,004 | $19,335 | $0 | $0 |
| 2020 | $2,030 | $19,498 | $0 | $0 |
| 2019 | $2,019 | $19,498 | $0 | $0 |
| 2018 | $1,770 | $16,740 | $0 | $0 |
| 2017 | $1,540 | $16,740 | $0 | $0 |
| 2016 | $1,157 | $12,314 | $0 | $0 |
| 2015 | $1,117 | $12,314 | $0 | $0 |
| 2014 | $702 | $7,451 | $0 | $0 |
| 2013 | -- | $8,680 | $0 | $0 |
Source: Public Records
Map
Nearby Homes
- 1130 Quari St
- 1170 Racine St
- 1269 Revere St
- 1350 Scranton St
- 1219 Tucson St
- 1001 Troy St
- 1273 Newark St
- 1160 Ursula St
- 930 Nome St
- 13045 E 13th Ave
- 1060 Ursula St
- 900 Troy St
- 850 Oakland St
- 841 N Oakland St
- 1616 Newark St
- 855 Newark St
- 1249 Worchester St
- 1157 Worchester St
- 1170 Kingston St
- 800 Nile St