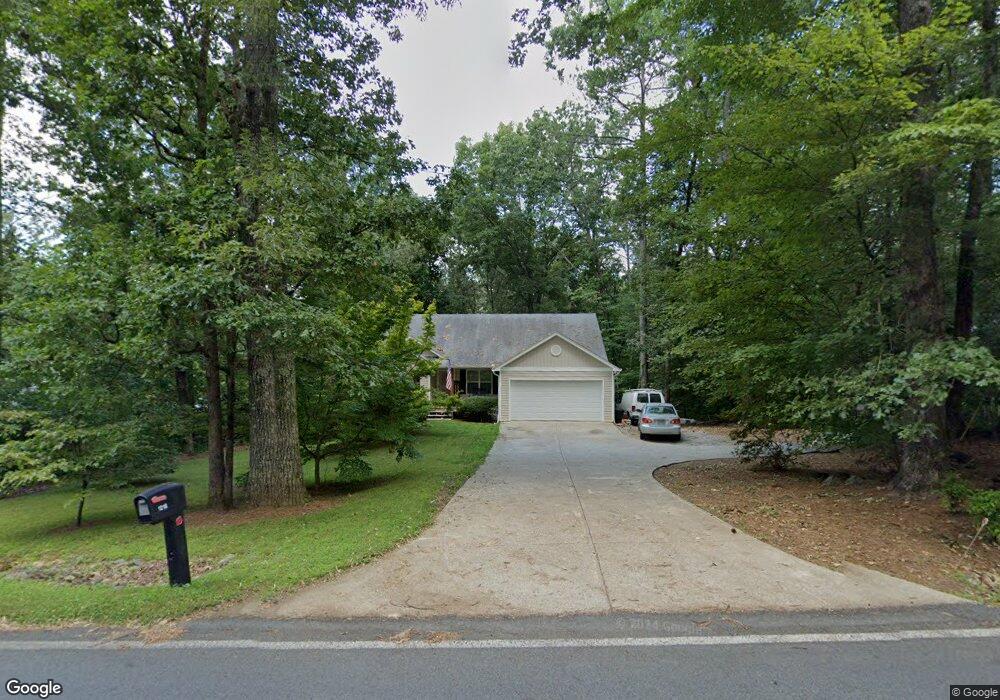
1218 Roundtop Rd Unit 2 Ellijay, GA 30540
Estimated Value: $359,000 - $408,000
3
Beds
2
Baths
1,378
Sq Ft
$275/Sq Ft
Est. Value
About This Home
This home is located at 1218 Roundtop Rd Unit 2, Ellijay, GA 30540 and is currently estimated at $379,417, approximately $275 per square foot. 1218 Roundtop Rd Unit 2 is a home located in Gilmer County with nearby schools including Ellijay Elementary School, Clear Creek Elementary School, and Clear Creek Middle School.
Ownership History
Date
Name
Owned For
Owner Type
Purchase Details
Closed on
Nov 11, 2019
Sold by
Davis James T
Bought by
Davis James T and Davis Julie Dae
Current Estimated Value
Purchase Details
Closed on
Jan 28, 2013
Sold by
Howell Arlene A
Bought by
Davis James T
Home Financials for this Owner
Home Financials are based on the most recent Mortgage that was taken out on this home.
Original Mortgage
$102,116
Interest Rate
3.3%
Mortgage Type
FHA
Purchase Details
Closed on
Jul 14, 2006
Sold by
Old South Developers Llc
Bought by
Old South Contractors Llc
Home Financials for this Owner
Home Financials are based on the most recent Mortgage that was taken out on this home.
Original Mortgage
$115,000
Interest Rate
6.6%
Mortgage Type
New Conventional
Purchase Details
Closed on
Aug 27, 2004
Bought by
Old South Developers Llc
Create a Home Valuation Report for This Property
The Home Valuation Report is an in-depth analysis detailing your home's value as well as a comparison with similar homes in the area
Home Values in the Area
Average Home Value in this Area
Purchase History
| Date | Buyer | Sale Price | Title Company |
|---|---|---|---|
| Davis James T | -- | -- | |
| Davis James T | $52,000 | -- | |
| Davis James T | $52,000 | -- | |
| Old South Contractors Llc | $35,000 | -- | |
| Howell Ronald T | $168,000 | -- | |
| Old South Developers Llc | -- | -- |
Source: Public Records
Mortgage History
| Date | Status | Borrower | Loan Amount |
|---|---|---|---|
| Previous Owner | Davis James T | $102,116 | |
| Previous Owner | Howell Ronald T | $115,000 |
Source: Public Records
Tax History Compared to Growth
Tax History
| Year | Tax Paid | Tax Assessment Tax Assessment Total Assessment is a certain percentage of the fair market value that is determined by local assessors to be the total taxable value of land and additions on the property. | Land | Improvement |
|---|---|---|---|---|
| 2024 | $2,031 | $131,080 | $10,800 | $120,280 |
| 2023 | $2,052 | $128,280 | $8,000 | $120,280 |
| 2022 | $1,814 | $103,080 | $8,000 | $95,080 |
| 2021 | $1,960 | $98,760 | $12,000 | $86,760 |
| 2020 | $1,498 | $68,120 | $6,000 | $62,120 |
| 2019 | $1,543 | $68,120 | $6,000 | $62,120 |
| 2018 | $1,563 | $68,120 | $6,000 | $62,120 |
| 2017 | $1,352 | $54,960 | $4,800 | $50,160 |
| 2016 | $1,373 | $54,680 | $4,000 | $50,680 |
| 2015 | $1,386 | $56,240 | $4,000 | $52,240 |
| 2014 | $1,172 | $45,720 | $4,000 | $41,720 |
| 2013 | -- | $44,480 | $4,000 | $40,480 |
Source: Public Records
Map
Nearby Homes
- 953 Round Top Rd
- 957 Round Top Rd
- 650 Wingate Rd
- 619 Linger Longer Dr
- 248 Tilly Farm Rd
- 375 Linger Longer Dr
- 756 Linger Longer Dr
- 100 Carters View Dr
- 562 Linger Longer Dr
- 2 Round Top Rd
- 177 Creekside Landing
- 385 Lakeside Park Dr
- Lt 291 Creekside Trail
- 351 Creekside Dr
- 1 Round Top Rd
- 8 Linda Ln
- 0 Highway 515 North - 26 79 Acres
- 34 Bodie Rd
- 70 Country Hills Rd
- 1218 Roundtop Rd
- Lt 25 Old South Farms
- Lt 25 Old South Farms Unit Lt 25
- 1266 Roundtop Rd
- Lt 29 Old South Farms
- Lt 29 Old South Farms Unit Lt 29
- Lt 31 Old South Farms
- 31 Old Dr S
- 31 Old South Dr Unit Lt 31
- 31 Old South Dr Unit 3
- 31 Old South Dr
- 31 Old South Dr
- 31 Old South Dr
- 31 Old South Dr
- Lt 37 Old South Farms
- Lt 37 Old South Farms Unit Lt 37
- 39 Old South Dr
- 5 Old South Dr S
- 39 Old Dr S
- 5 Old Dr S