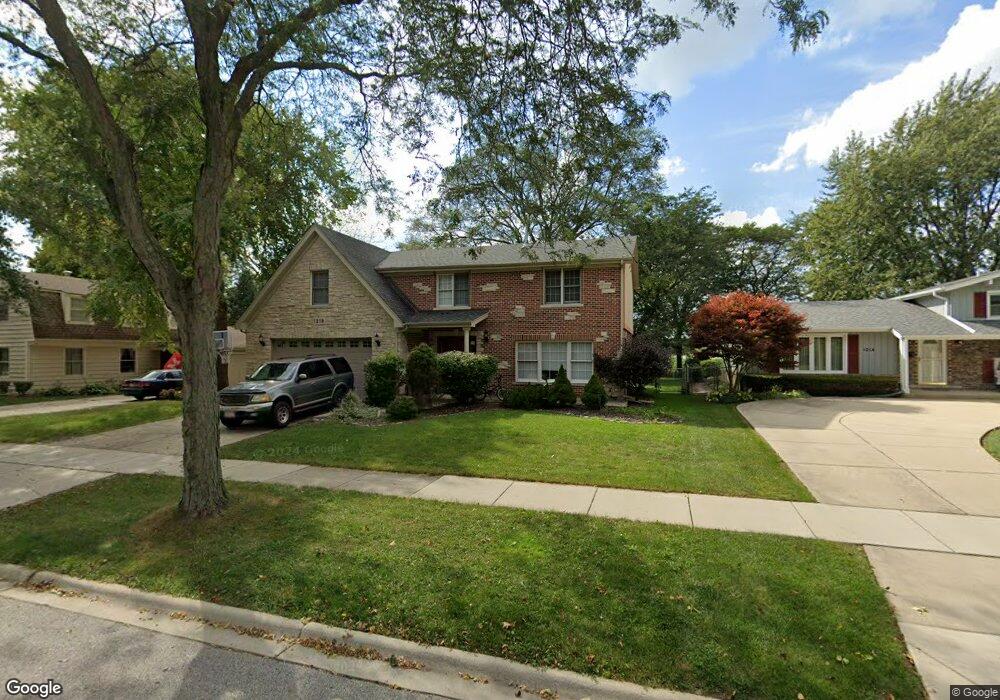
1218 S Patton Ave Arlington Heights, IL 60005
Busse Woods NeighborhoodEstimated Value: $607,000 - $742,000
5
Beds
3
Baths
3,174
Sq Ft
$215/Sq Ft
Est. Value
About This Home
This home is located at 1218 S Patton Ave, Arlington Heights, IL 60005 and is currently estimated at $683,442, approximately $215 per square foot. 1218 S Patton Ave is a home located in Cook County with nearby schools including Holmes Jr High School, Juliette Low Elementary School, and Rolling Meadows High School.
Ownership History
Date
Name
Owned For
Owner Type
Purchase Details
Closed on
Mar 17, 2005
Sold by
Naughton Myles A and Naughton Nancy B
Bought by
Krol Dariusz
Current Estimated Value
Home Financials for this Owner
Home Financials are based on the most recent Mortgage that was taken out on this home.
Original Mortgage
$369,000
Outstanding Balance
$187,197
Interest Rate
5.62%
Mortgage Type
Unknown
Estimated Equity
$496,245
Purchase Details
Closed on
Sep 17, 2001
Sold by
Drath Edwin H and Drath Ella M
Bought by
Naughton Myles A
Home Financials for this Owner
Home Financials are based on the most recent Mortgage that was taken out on this home.
Original Mortgage
$256,800
Interest Rate
6.8%
Purchase Details
Closed on
Nov 14, 1994
Sold by
American National Bk & Tr Co Of Chicago
Bought by
Drath Edwin H and Drath Ella M
Create a Home Valuation Report for This Property
The Home Valuation Report is an in-depth analysis detailing your home's value as well as a comparison with similar homes in the area
Home Values in the Area
Average Home Value in this Area
Purchase History
| Date | Buyer | Sale Price | Title Company |
|---|---|---|---|
| Krol Dariusz | $410,000 | Premier Title | |
| Naughton Myles A | $321,000 | -- | |
| Drath Edwin H | -- | -- |
Source: Public Records
Mortgage History
| Date | Status | Borrower | Loan Amount |
|---|---|---|---|
| Open | Krol Dariusz | $369,000 | |
| Previous Owner | Naughton Myles A | $256,800 | |
| Closed | Naughton Myles A | $64,200 |
Source: Public Records
Tax History Compared to Growth
Tax History
| Year | Tax Paid | Tax Assessment Tax Assessment Total Assessment is a certain percentage of the fair market value that is determined by local assessors to be the total taxable value of land and additions on the property. | Land | Improvement |
|---|---|---|---|---|
| 2024 | $11,555 | $47,983 | $9,800 | $38,183 |
| 2023 | $10,999 | $47,983 | $9,800 | $38,183 |
| 2022 | $10,999 | $47,983 | $9,800 | $38,183 |
| 2021 | $10,307 | $39,801 | $6,370 | $33,431 |
| 2020 | $10,749 | $42,257 | $6,370 | $35,887 |
| 2019 | $10,956 | $47,480 | $6,370 | $41,110 |
| 2018 | $10,151 | $39,732 | $5,390 | $34,342 |
| 2017 | $10,022 | $39,732 | $5,390 | $34,342 |
| 2016 | $10,791 | $44,335 | $5,390 | $38,945 |
| 2015 | $10,148 | $39,210 | $4,900 | $34,310 |
| 2014 | $10,032 | $39,210 | $4,900 | $34,310 |
| 2013 | $9,773 | $39,210 | $4,900 | $34,310 |
Source: Public Records
Map
Nearby Homes
- 1107 W White Oak St
- 1515 S Harvard Ave
- 1114 S Fernandez Ave
- 1306 S New Wilke Rd Unit 2B
- 1322 S New Wilke Rd Unit 1C
- 1025 S Fernandez Ave Unit 3M
- 1206 S New Wilke Rd Unit 108
- 1607 S Kaspar Ave
- 1227 S Old Wilke Rd Unit 306
- 1207 S Old Wilke Rd Unit 303
- 1860 W Surrey Park Ln Unit 1C
- 1217 S Old Wilke Rd Unit 11110
- 1217 S Old Wilke Rd Unit 11406
- 1602 W Orchard Place Unit 1602C
- 1117 S Old Wilke Rd Unit 206
- 1107 S Old Wilke Rd Unit 201
- 5451 Elizabeth Place Unit 906
- 751 S Dwyer Ave Unit F
- 5600 Astor Ln Unit 103
- 2312 Algonquin Rd Unit 3
- 1214 S Patton Ave
- 1222 S Patton Ave
- 1210 S Patton Ave
- 1226 S Patton Ave
- 1221 S Patton Ave
- 1217 S Patton Ave
- 1206 S Patton Ave
- 1209 S Patton Ave
- 1225 S Patton Ave
- 1202 S Patton Ave
- 1205 S Patton Ave
- 1112 W White Oak St
- 1207 W White Oak St
- 1111 W Cypress Dr
- 1115 W Cypress Dr
- 1211 W White Oak St
- 1215 W White Oak St
- 1108 W White Oak St Unit 4
- 1121 W Cypress Dr
- 1124 W Cypress Dr