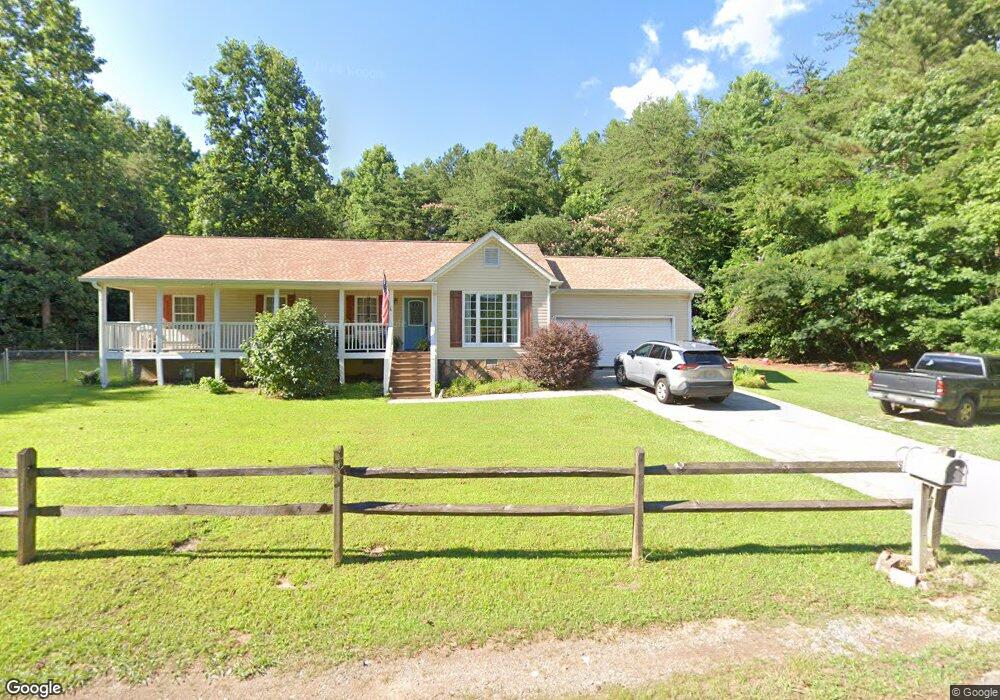
1218 Twin Mountain Lake Cir Unit 40 Talking Rock, GA 30175
Estimated Value: $368,463 - $459,000
3
Beds
2
Baths
1,802
Sq Ft
$230/Sq Ft
Est. Value
About This Home
This home is located at 1218 Twin Mountain Lake Cir Unit 40, Talking Rock, GA 30175 and is currently estimated at $413,866, approximately $229 per square foot. 1218 Twin Mountain Lake Cir Unit 40 is a home located in Pickens County with nearby schools including Hill City Elementary School, Pickens County Middle School, and Pickens County High School.
Ownership History
Date
Name
Owned For
Owner Type
Purchase Details
Closed on
Apr 30, 2021
Sold by
Cox Michelle L
Bought by
Holcombe Robert D and Holcombe Judy G
Current Estimated Value
Home Financials for this Owner
Home Financials are based on the most recent Mortgage that was taken out on this home.
Original Mortgage
$102,000
Outstanding Balance
$92,437
Interest Rate
3.1%
Mortgage Type
New Conventional
Estimated Equity
$321,429
Purchase Details
Closed on
Apr 26, 2012
Sold by
Sec Of Housing & U
Bought by
Reed Lindsie
Purchase Details
Closed on
Sep 6, 2011
Sold by
Ragano Christy C
Purchase Details
Closed on
Nov 13, 2003
Sold by
Littlefield Steven K
Bought by
Ragano Michael
Purchase Details
Closed on
Sep 14, 2000
Sold by
Foster Steve
Bought by
Littlefield Steven K
Purchase Details
Closed on
May 1, 2000
Bought by
Foster Steve
Create a Home Valuation Report for This Property
The Home Valuation Report is an in-depth analysis detailing your home's value as well as a comparison with similar homes in the area
Home Values in the Area
Average Home Value in this Area
Purchase History
| Date | Buyer | Sale Price | Title Company |
|---|---|---|---|
| Holcombe Robert D | $275,000 | -- | |
| Reed Lindsie | $75,000 | -- | |
| -- | $138,452 | -- | |
| Ragano Michael | $129,100 | -- | |
| Littlefield Steven K | $105,900 | -- | |
| Foster Steve | $15,000 | -- |
Source: Public Records
Mortgage History
| Date | Status | Borrower | Loan Amount |
|---|---|---|---|
| Open | Holcombe Robert D | $102,000 |
Source: Public Records
Tax History Compared to Growth
Tax History
| Year | Tax Paid | Tax Assessment Tax Assessment Total Assessment is a certain percentage of the fair market value that is determined by local assessors to be the total taxable value of land and additions on the property. | Land | Improvement |
|---|---|---|---|---|
| 2024 | $2,175 | $109,885 | $18,000 | $91,885 |
| 2023 | $2,235 | $109,885 | $18,000 | $91,885 |
| 2022 | $2,235 | $109,885 | $18,000 | $91,885 |
| 2021 | $2,394 | $109,885 | $18,000 | $91,885 |
| 2020 | $1,111 | $54,486 | $10,200 | $44,286 |
| 2019 | $1,136 | $54,486 | $10,200 | $44,286 |
| 2018 | $1,147 | $54,486 | $10,200 | $44,286 |
| 2017 | $1,145 | $54,486 | $10,200 | $44,286 |
| 2016 | $1,184 | $54,486 | $10,200 | $44,286 |
| 2015 | $1,213 | $56,886 | $12,600 | $44,286 |
| 2014 | $904 | $43,600 | $12,600 | $31,000 |
| 2013 | -- | $43,600 | $12,600 | $31,000 |
Source: Public Records
Map
Nearby Homes
- 1151 Twin Mountain Lake Cir
- 688 Twin Mountain Lake Dr
- 115 Twin Mountain Lake Cir
- 83 Twin Mountain Lake Cir
- 579 Twin Mountain Lake Cir
- 580 Twin Mountain Lake Cir
- 414 Twin Mountain Lake Cir
- 0 Oakland Ct Unit 10550033
- 0 Oakland Ct Unit 7603411
- 0 Meadowlands Dr Unit 10535692
- 0 Meadowlands Dr Unit 7591110
- 1581 Twin Mountain Lake Cir
- 2961 Talking Rock Rd
- 3 Meadowlands Dr
- Lot 14 Bravo Way
- Lot 24 Bravo Way
- Lot 17 Bravo Way
- Lot 23 Bravo Way
- Lot 25 Bravo Way
- LT 272 Highgrove Dr
- 1218 Twin Mountain Lake Cir
- 1284 Twin Mountain Lake Cir
- 1140 Twin Mountain Lake Cir
- 1265 Twin Mountain Lake Cir
- 1126 Twin Mountain Lake Cir
- 1293 Twin Mountain Lake Cir
- 743 Twin Mountain Lake Cir
- 735 Twin Mountain Lake Cir
- 735 Twin Mountain Lakes
- 717 Twin Mountain Lake Cir
- 1311 Twin Mountain Lake Cir
- 708 Twin Mountain Lake Dr
- 715 Twin Mountain Lake Dr
- 227 Twin Mountain Lake Cir
- 227 Twin Mountain Lake Cir
- 1360 Twin Mountain Lake Cir
- 699 Twin Mountain Lake Cir
- 688 Twin Mountain Lake Cir
- 200 Twin Mountain Lake Cir
- 805 Twin Mountain Lake Cir