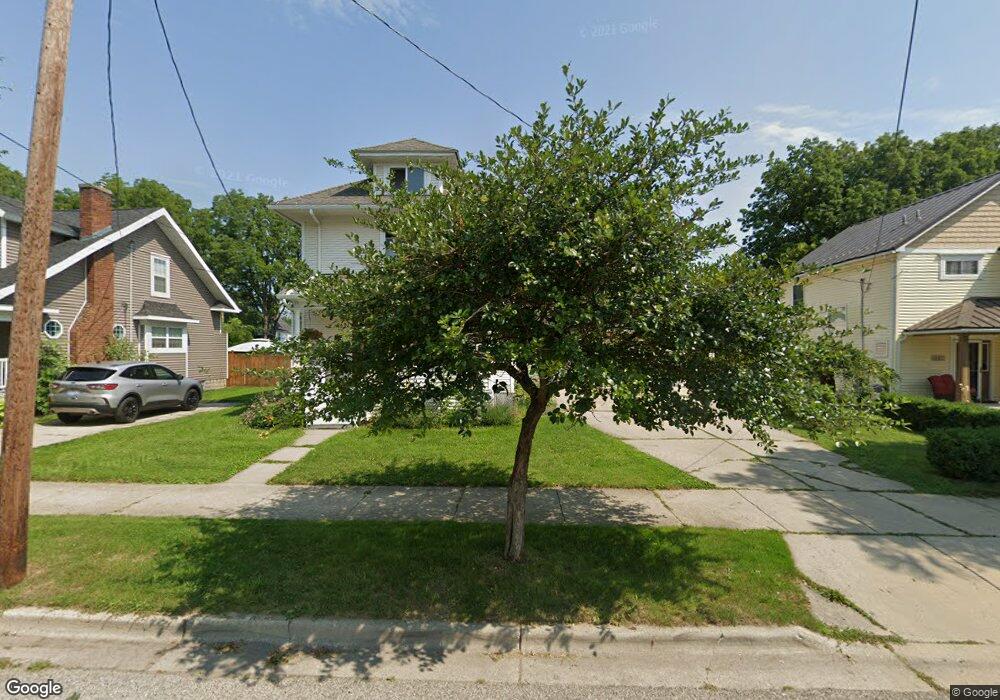
1218 W Allegan St Lansing, MI 48915
Westside NeighborhoodEstimated Value: $127,000 - $170,917
--
Bed
--
Bath
1,452
Sq Ft
$103/Sq Ft
Est. Value
About This Home
This home is located at 1218 W Allegan St, Lansing, MI 48915 and is currently estimated at $149,479, approximately $102 per square foot. 1218 W Allegan St is a home located in Ingham County with nearby schools including Riddle Elementary School, Pattengill Academy, and J.W. Sexton High School.
Ownership History
Date
Name
Owned For
Owner Type
Purchase Details
Closed on
Mar 28, 2018
Sold by
Rogers Chad E and Rogers Rebecca L
Bought by
Rogers Chad E and Rogers Rebecca L
Current Estimated Value
Purchase Details
Closed on
Dec 23, 2004
Sold by
Coolidge Road Equity Co Llc
Bought by
Rogers Chad E and Boehm Rebecca L
Home Financials for this Owner
Home Financials are based on the most recent Mortgage that was taken out on this home.
Original Mortgage
$128,800
Outstanding Balance
$64,718
Interest Rate
5.78%
Mortgage Type
Purchase Money Mortgage
Estimated Equity
$84,761
Purchase Details
Closed on
Apr 15, 2004
Sold by
Mdoka Luwina
Bought by
Wells Fargo Home Mortgage Inc
Purchase Details
Closed on
Nov 15, 2002
Sold by
Dorsham Roger and Fedewa Stanley
Bought by
Mdoka Luwina
Home Financials for this Owner
Home Financials are based on the most recent Mortgage that was taken out on this home.
Original Mortgage
$78,379
Interest Rate
6.23%
Mortgage Type
FHA
Purchase Details
Closed on
Sep 1, 2002
Sold by
Emip Llc
Bought by
Four Leaf Clover Properties Llc
Create a Home Valuation Report for This Property
The Home Valuation Report is an in-depth analysis detailing your home's value as well as a comparison with similar homes in the area
Home Values in the Area
Average Home Value in this Area
Purchase History
| Date | Buyer | Sale Price | Title Company |
|---|---|---|---|
| Rogers Chad E | -- | None Available | |
| Rogers Chad E | $132,800 | Tri Title Agency | |
| Wells Fargo Home Mortgage Inc | $82,786 | -- | |
| Mdoka Luwina | $79,610 | Transnation Title | |
| Four Leaf Clover Properties Llc | -- | -- |
Source: Public Records
Mortgage History
| Date | Status | Borrower | Loan Amount |
|---|---|---|---|
| Open | Rogers Chad E | $128,800 | |
| Previous Owner | Mdoka Luwina | $78,379 |
Source: Public Records
Tax History Compared to Growth
Tax History
| Year | Tax Paid | Tax Assessment Tax Assessment Total Assessment is a certain percentage of the fair market value that is determined by local assessors to be the total taxable value of land and additions on the property. | Land | Improvement |
|---|---|---|---|---|
| 2025 | $2,836 | $74,900 | $8,100 | $66,800 |
| 2024 | $22 | $71,400 | $8,100 | $63,300 |
| 2023 | $2,660 | $59,100 | $8,100 | $51,000 |
| 2022 | $2,398 | $53,700 | $6,300 | $47,400 |
| 2021 | $2,348 | $49,300 | $9,100 | $40,200 |
| 2020 | $2,334 | $47,100 | $9,100 | $38,000 |
| 2019 | $2,237 | $45,500 | $9,100 | $36,400 |
| 2018 | $2,097 | $40,600 | $9,100 | $31,500 |
| 2017 | $2,007 | $40,600 | $9,100 | $31,500 |
| 2016 | $1,920 | $37,100 | $9,100 | $28,000 |
| 2015 | $1,920 | $35,700 | $18,216 | $17,484 |
| 2014 | $1,920 | $33,900 | $17,500 | $16,400 |
Source: Public Records
Map
Nearby Homes
- 1234 W Allegan St
- 1233 W Michigan Ave
- 1319 W Michigan Ave
- 1232 W Michigan Ave
- 201 S Jenison Ave
- 1128 W Michigan Ave
- 1128 W Washtenaw St
- 1314 W Ottawa St
- 1140 W Lenawee St
- 1128 W Lenawee St
- 1804 W Michigan Ave
- 1309 W Lenawee St
- 1632 Inverness Ave
- 314 Memphis St
- 1528 W Shiawassee St
- 1313 S Genesee Dr
- 425 N Jenison Ave
- 416 N Martin Luther King Junior Blvd
- 418 N Martin Luther King Junior Blvd
- 422 N Martin Luther King Junior Blvd
- 1216 W Allegan St
- 1214 W Allegan St
- 1224 W Allegan St
- 1230 W Allegan St
- 1212 W Allegan St
- 1232 W Allegan St
- 1225 W Michigan Ave
- 1221 W Chigan
- 1221 W Michigan Ave
- 1229 W Michigan Ave
- 1202 W Allegan St
- 1235 W Chigan
- 1217 W Allegan St
- 1211 W Michigan Ave
- 1301 W Chigan
- 1236 W Allegan St
- 1301 W Michigan Ave
- 1200 W Allegan St
- 1211 W Chigan
- 1207 W Michigan Ave