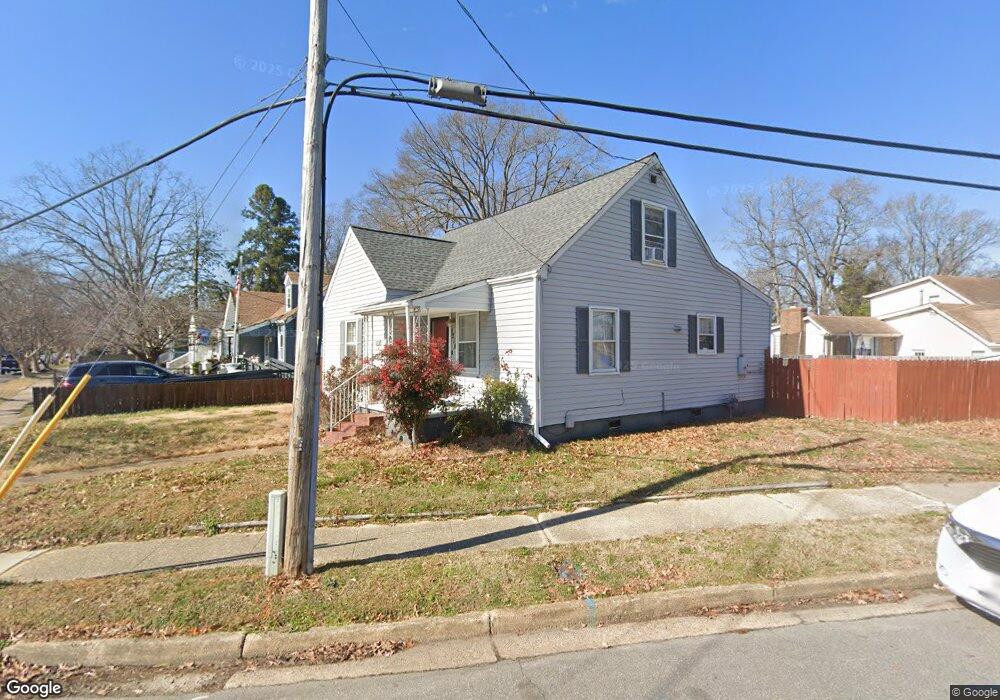
1218 Warwick Ave Norfolk, VA 23503
Bay View NeighborhoodEstimated Value: $274,000 - $293,234
3
Beds
1
Bath
1,322
Sq Ft
$215/Sq Ft
Est. Value
About This Home
This home is located at 1218 Warwick Ave, Norfolk, VA 23503 and is currently estimated at $283,809, approximately $214 per square foot. 1218 Warwick Ave is a home located in Norfolk City with nearby schools including Oceanair Elementary School, Northside Middle School, and Norview High School.
Ownership History
Date
Name
Owned For
Owner Type
Purchase Details
Closed on
Jan 5, 2021
Sold by
Streeter Krysti B
Bought by
Streeter Krysti B and Streeter Jonathan B
Current Estimated Value
Purchase Details
Closed on
Jan 4, 2017
Sold by
The Secretary Of Housing And Urban Devel
Bought by
Streeter Krysti B
Purchase Details
Closed on
Oct 6, 2016
Sold by
Trustee Services Of Virginia Llc Substit and Lushia Brian P
Bought by
The Secretary Of Housing And Urban Devel
Purchase Details
Closed on
Mar 14, 2013
Sold by
Wryk Emily
Bought by
Lushia Brian P
Home Financials for this Owner
Home Financials are based on the most recent Mortgage that was taken out on this home.
Original Mortgage
$150,228
Interest Rate
3.37%
Mortgage Type
FHA
Purchase Details
Closed on
Feb 25, 2005
Sold by
Sheehan Edward F
Bought by
Ural Emily S
Home Financials for this Owner
Home Financials are based on the most recent Mortgage that was taken out on this home.
Original Mortgage
$145,000
Interest Rate
5.5%
Mortgage Type
New Conventional
Create a Home Valuation Report for This Property
The Home Valuation Report is an in-depth analysis detailing your home's value as well as a comparison with similar homes in the area
Home Values in the Area
Average Home Value in this Area
Purchase History
| Date | Buyer | Sale Price | Title Company |
|---|---|---|---|
| Streeter Krysti B | -- | None Available | |
| Streeter Krysti B | $88,000 | Barristers Of Va | |
| The Secretary Of Housing And Urban Devel | $95,120 | None Available | |
| Lushia Brian P | $153,000 | Fidelity National Title Ins | |
| Ural Emily S | $145,000 | -- |
Source: Public Records
Mortgage History
| Date | Status | Borrower | Loan Amount |
|---|---|---|---|
| Previous Owner | Lushia Brian P | $150,228 | |
| Previous Owner | Ural Emily S | $145,000 |
Source: Public Records
Tax History
| Year | Tax Paid | Tax Assessment Tax Assessment Total Assessment is a certain percentage of the fair market value that is determined by local assessors to be the total taxable value of land and additions on the property. | Land | Improvement |
|---|---|---|---|---|
| 2025 | $3,200 | $256,000 | $112,200 | $143,800 |
| 2024 | $2,948 | $239,700 | $102,000 | $137,700 |
| 2023 | $1,970 | $229,300 | $102,000 | $127,300 |
| 2022 | $2,556 | $204,500 | $77,200 | $127,300 |
| 2021 | $2,255 | $180,400 | $73,500 | $106,900 |
| 2020 | $2,124 | $169,900 | $65,000 | $104,900 |
| 2019 | $1,996 | $159,700 | $59,000 | $100,700 |
| 2018 | $1,894 | $151,500 | $59,000 | $92,500 |
| 2017 | $1,687 | $146,700 | $59,000 | $87,700 |
| 2016 | $1,653 | $125,100 | $56,000 | $69,100 |
| 2015 | $1,439 | $125,100 | $56,000 | $69,100 |
| 2014 | $1,439 | $125,100 | $56,000 | $69,100 |
Source: Public Records
Map
Nearby Homes
- 1212 Oak Park Ave
- 1050 E Chester St
- 8911 London St
- 1335 Modoc Ave
- 1214 Virgilina Ave
- 1138 Hillside Ave Unit E
- 719 Dudley Ave
- 1005 Hillside Ave
- 1222 E Ocean View Ave Unit 204
- 1027 E Ocean View Ave
- 8723 Chesapeake Blvd
- 9711 Chesapeake St Unit C
- 1420 Baychester Ave
- 1423 E Ocean View Ave Unit 5
- 1423 E Ocean View Ave Unit 4
- 9420 Willow Terrace
- 700 Creamer Rd
- 828 E Ocean View Ave Unit 1
- 810 E Ocean View Ave Unit 201
- 8583 Wayland St
- 1214 Warwick Ave
- 9345 Warwick Ave
- 1201 Oak Park Ave
- 1210 Warwick Ave
- 1212 Warwick Ave
- 9401 Warwick Ave
- 1205 Oak Park Ave
- 1217 Warwick Ave
- 1200 Oak Park Ave
- 9403 Warwick Ave
- 1204 Warwick Ave
- 1206 Oak Park Ave
- 1143 Modoc Ave
- 1209 Warwick Ave
- 1205 Warwick Ave
- 1209 Oak Park Ave
- 1208 Oak Park Ave
- 1200 Warwick Ave
- 8921 Hastings St
- 1208 Pineview Ave
Your Personal Tour Guide
Ask me questions while you tour the home.